使用期限*
许可形式单机
原产地美国
介质下载
适用平台windows
科学软件网专注提供科研软件。截止目前,共代理千余款,软件涵盖各个学科。除了软件,科学软件网还提供课程,包含34款软件,66门课程。热门软件有:spss,stata,gams,sas,minitab,matlab,mathematica,lingo,hydrus,gms,pscad,mplus,tableau,eviews,nvivo,gtap,sequncher,simca等等。
Worksheet Window
The worksheet window contains commands to display, edit, enter, and
save data. The worksheet window has several useful and powerful editing,
transformation, and statistical operations available. Several import and
export options are available for opening data files from other spreadsheet
programs. The Data Tools tab is automatically selected when you open or
switch to a worksheet document.
To enter data in a worksheet, use the File | Open command to open an
existing data file or click the File | New | Worksheet command to create a
blank worksheet. Data already used to create plots can be opened in the
worksheet window with the Graph Tools | Worksheet | Display command.

Grapher是一个功能全面的科学绘图软件包,允许用户以多种格式导入数据,创建和组合多种二维和三维图形类型,并以非常详细的方式定制这些图形。
数据可视化
好的呈现您的数据。Grapher提供70多种2D和3D绘图选项来大限度的显示数据。
分析数据
不会**数据可能隐藏的有价值信息。使用Grapher广泛的分析图表、工具和统计功能来识别趋势,找到新的见解和定位机会。Grapher提供对数据的整体视图。
结果说明
Grapher提供广泛的图形类型选项和无数的定制选项,让您以非常*理解的格式表达您复杂的想法。让您的数据跟Grapher说话。
值得信任的解决方案
Grapher受到**数以千计的科学家、和商业的信任。他们信任Grapher并用它展示数据。
功能
创建的图表
快速创建令人惊叹的信息丰富的2D和3D图形。有**过70个不同的图表类型并使用Grapher已有的图表功能来展现您的数据。

Grapher统计工具:
插入自定义或预定义的拟合曲线
运用置信区间
包括错误条
对原始数据进行统计计算
显示统计报告

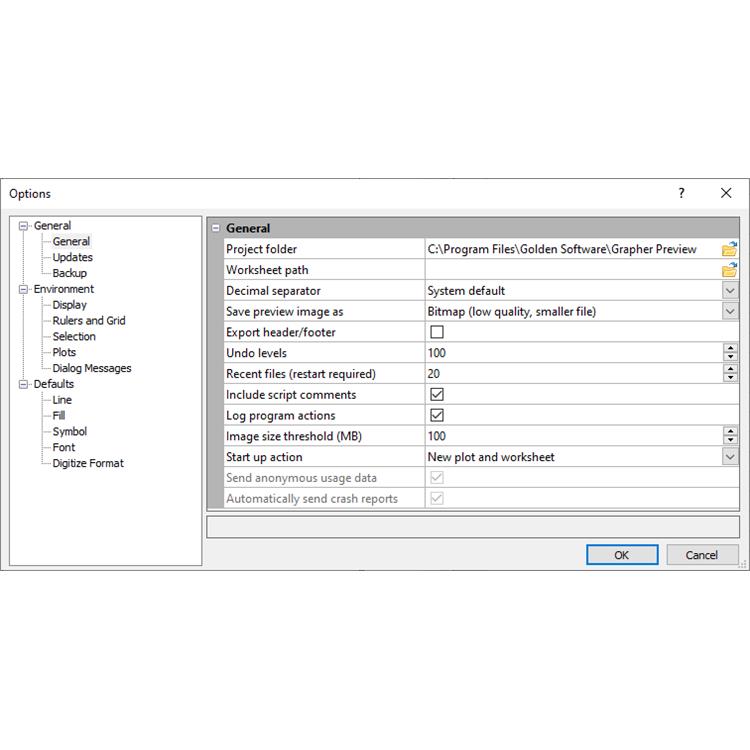
Creating Graphs Using Templates
Templates are used to set graphing preferences in Grapher. A template
file does not contain any reference to a data file. This means that once the
template graph is created, you can use the template to create a new graph
with any compatible data set. To create a new plot from a template:
1. Click the File | New | Plot from Template command.
2. Select a .GRT template file in the Open dialog, and click Open.
3. Select the data file to use with the template. Select the Use this
worksheet for remaining items option if all the plots in a template use
the same worksheet.
4. Check the Set columns if you want to change the column specifications
for individual plots in the graph.
5. Click the Open button and the new plot is created.
科学软件网不仅提供软件产品,更有多项附加服务免费提供,让您售后**!
http://turntech8843.b2b168.com