使用期限*
许可形式单机和网络版
原产地美国
介质下载
适用平台windows
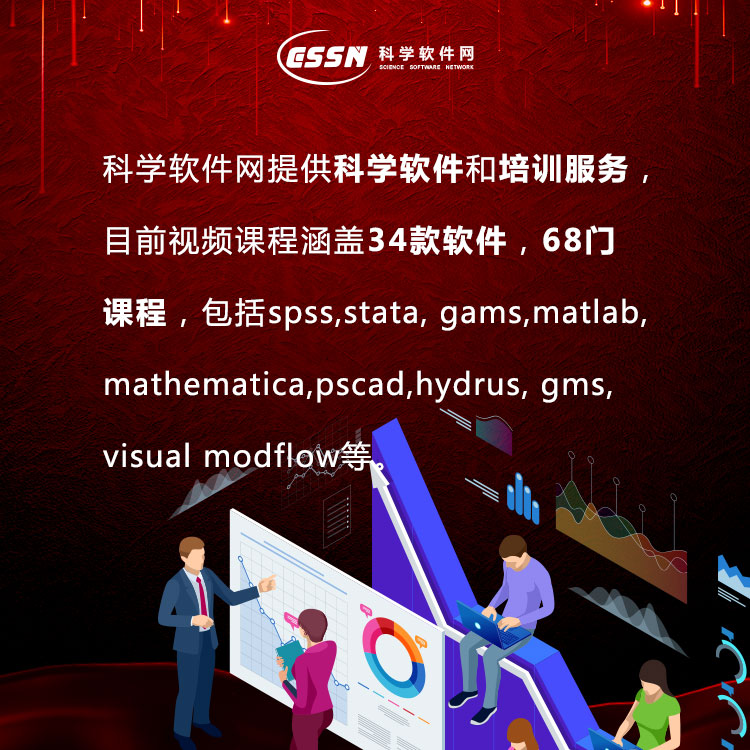
科学软件网专注提供科研软件。截止目前,共代理千余款,软件涵盖各个学科。除了软件,科学软件网还提供课程,包含34款软件,66门课程。热门软件有:spss,stata,gams,sas,minitab,matlab,mathematica,lingo,hydrus,gms,pscad,mplus,tableau,eviews,nvivo,gtap,sequncher,simca等等。
The “select left and change right” procedure makes editing your graphs quick and easy. SigmaPlot takes you beyond simple spreadsheets to help you show off your work clearly and precisely. With SigmaPlot, you can produce high-quality graphs without spending hours in front of a computer. SigmaPlot offers seamless Microsoft Office® integration, so you can easily access data from Microsoft Excel® spreadsheets and present your results in Microsoft PowerPoint® presentations.

统计分析不再是一项艰巨的任务。通过将SigmaStat集成到软件中,SigmaPlot现在提供50多种科学研究中常用的统计检验。基于软件的顾问提供适当的统计检验方法。原始数据和索引数据格式被接受以避免数据重新格式化。
后台如果检测到违法了数据假设,如果是真的,建议使用正确的检验方法。生成具有描述性解释的报告,并且可以给每个检验生成图形。
全局曲线拟合
SigmaPlot现在采用了全新的用户界面,允许用户轻松地设置全局曲线拟合。这使得用户能够*地在多个数据集上共享一个或多个等式参数。
动态曲线拟合
非线性曲线拟合是已知的话,在某些情况下会产生不正确的结果。问题是您不一定知道它是否正确。动态曲线拟合设计来确定这是否正确,如果不是,那么什么是合适的。
咨询统计分析师
SigmaPlot具有完整的咨询统计分析功能。SigmaPlot是一个完整的图形和咨询统计套件。SigmaStat所有的统计分析功能以及一些新的统计功能都已经集成到SigamPlot中。SigmaPlot用户根据一步一步的分析,执行强大的统计分析功能,哪怕用户并不是统计,也可以完成。
标准曲线宏
除了已经计算的EC50值之外。用户还可以计算其他用户输入的EC值,例如EC40和EC60,并立即计算它们。
改进的三维图形定制
在SigmaPlot的老版本中,只需点击一下鼠标就可以选择2D图片中的所有对象。但是3D图片中的图片却不可以。现在SigmaPlot增加了所有3D图形对象的鼠标可选性,并具有定制所有3D对象的能力。
Publish your charts and graphs anywhere
Create stunning slides, display your graphs in reports or further customize your graphs in drawing packages. Save graphs for publication in a technical journal, article or paper with SigmaPlot’s wide range of graphic export options. Presenting and publishing your results has never been easier – or looked this good.
Create customized reports with SigmaPlot’s Report Editor or embed your graphs in any OLE (Object Linking and Embedding) container – word processors, Microsoft PowerPoint or another graphics program. Then, double click your graph to edit directly inside your document. Quickly send your high-resolution graphs online to share with others.[/toggle] [toggle border=’2′ title=’Share High Quality Graphs on the Web’]
Share the data behind your web-based graphs with colleagues and students
Enable colleagues to print your full report from your intranetor Web site directly from their browsers – without compromising the quality of the graphs
Create an optional password while exporting your graph to limit data access to authorized users
Produce Web documents without knowing HTML, or embed SigmaPlot Web object graphs in existing HTML files to create interactive electronic reports

在任何地方发布图表
创建精美的幻灯片,在报表中显示图表,或者在绘图中进一步自定义图形。SigmaPlot广泛的图形输出选项可以让您保存图形并发表在、杂志或中。展示和发布您的结果就是这么的*---并且看起来很不错。用SigmaPlot的Report Editor创建自定义报表或任何OLE container中嵌入图形---文字处理器、Microsoft PowerPoint或图形程序。只需双击图形就可以直接在文档中进行编辑。快速发布您的高分辨率图形在线与他人分享。
SigmaPlot provides more than 100 different 2-D and 3-D graph types. From simple 2-D scatter plots to compelling contour, Forest and radar plots, SigmaPlot gives you the exact technical graph type you need for your demanding research. With so many options, you can always find the best visual representation of your data.
科学软件网主要提供以下科学软件服务:
1、软件培训服务:与国内大学合作,聘请业内人士定期组织软件培训,截止目前,已成功举办软件培训四十多期,累计学员2000余人,不仅让学员掌握了软件使用技巧,加深了软件在本职工作中的应用深度,而且也为**业人士搭建起了沟通的桥梁;
2、软件服务:提供软件试用版、演示版、教程、手册和参考资料的服务;
3、解决方案咨询服务:科学软件网可向用户有偿提供经济统计、系统优化、决策分析、生物制药等方面的解决方案咨询服务;
4、软件升级及技术支持服务:科学软件网可向用户提供软件的本地化技术支持服务,包括软件更新升级、软件故障排除、安装调试、培训等;
5、行业研讨服务:科学软件网会针对不**业,邀请国内外以及软件厂商技术人员,不定期在国内举办大型研讨会,时刻关注*技术,为国内行业技术发展提供导向。
http://turntech8843.b2b168.com