使用期限租赁或*
许可形式单机和网络版
原产地美国
介质下载
适用平台window,mac,linux
科学软件网销售软件达19年,有丰富的销售经验以及客户资源,提供的产品涵盖各个学科,包括经管,仿真,地球地理,生物化学,工程科学,排版及网络管理等。此外,我们还提供很多附加服务,如:现场培训、课程、解决方案、咨询服务等。
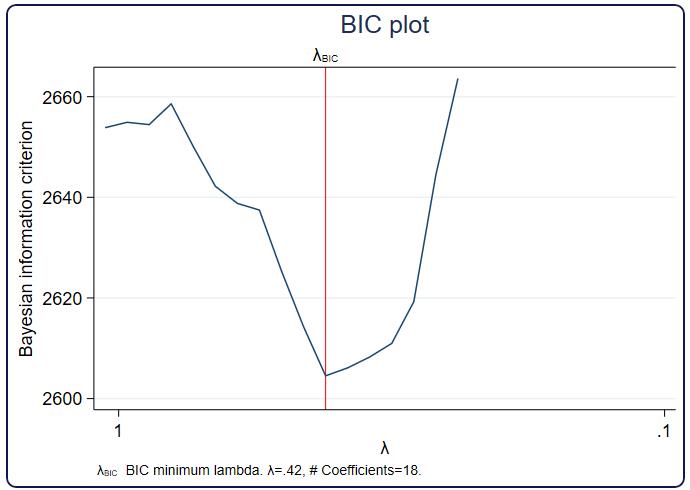
Sample-size analysis for confidence intervals in Stata 16
The new ciwidth command performs Precision and Sample Size (PrSS) analysis, which is sample-size analysis for confidence intervals (CIs). This method is used when you are planning a study and you want to optimally allocate resources when CIs are to be used for inference. Said differently, you use this method when you want to estimate the sample size required to achieve the desired precision of a CI in a planned study.
ciwidth produces sample sizes, precision, and more that are required for the
• CI for one mean
• CI for one variance
• CI for two independent means
• CI for two paired means
The control panel interface lets you select the analysis type and input assumptions to obtain desired results.
ciwidth allows results to be displayed in customizable tables and graphs.
ciwidth also provides facilities for you to add your own methods.
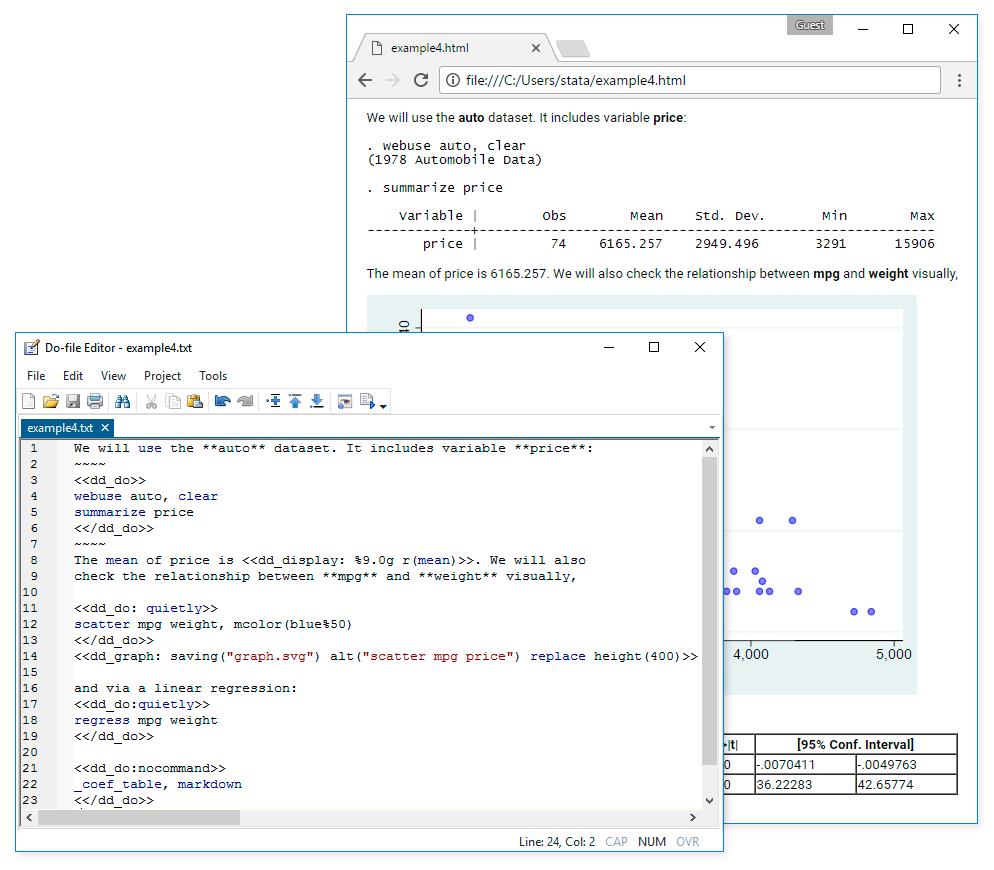
出版质量的图形
Stata轻松生成出版质量、风格迥异的图形。您可以编写脚本并以可复制的方式生成成百上千个图形,并且可以以EPS
或TIF格式输出打印、以PNG格式或SVG格式输出放到网上、或PDF格式输出预览。使用这个图形编辑器可更改图形的任何
方面,或添加标题、注释、横线、箭头和文本。
Nonlinear DSGE models in Stata 15
In Stata 15, we introduced the dsge command for fitting linear DSGE models, which are time-series models used in economics and finance. These models are an alternative to traditional forecasting models. Both attempt to explain aggregate economic phenomena, but DSGE models do this on the basis of models derived from microeconomic theory.
New in Stata 16, the dsgenl command fits nonlinear DSGE models. Most DSGE models are nonlinear, and this means that you no longer need to linearize them by hand. When you enter equations into dsgenl, it linearizes them for you.
After estimating the parameters of your model with dsgenl, you can obtain the transition and policy matrices; determine the model’s steady state; estimate variables’ variances, covariances, and autocovariances implied by the system of equations; and create and graph impulse–response functions.
This is likely to be the favorite feature of macroeconomists and anyone working in a central bank.

Stata 是一套提供其使用者数据分析、数据管理以及绘制图表的完整及整合性统计软件。它提供许许多多功能,包含线性混合模型、均衡重复反复及多项式普罗比模式。用Stata绘制的统计图形相当精美。
统计功能介绍
Stata使得大量的统计工具用于指尖
标准方法,如
基本表格和总结
案例对照分析
ARIMA
ANOVA 和MANOVA
线性回归
时间序列平滑
广义线性模型(GLM)
聚类分析
对比和比较
功率分析
样本选择
……
方法,如
多层模型
生存分析
动态面板数据回归
结构方程建模
二进制,计数和审查结果
ARCH
多重替代法
调查数据
Treatment effects
统计
贝叶斯分析
……
Stata的数据管理功能让您控制所有类型的数据。
您可以重组数据,管理变量,并收集各组并重复统计。您可以处理字节,整数,long, float,double和字符串变量(包括BLOB和达到20亿个字符的字符串)。Stata还有一些的工具用来管理的数据,如生存/时间数据、时间序列数据、面板/纵向数据、分类数据、多重替代数据和调查数据。
Stata轻松生成出版质量、风格迥异的图形。您可以编写脚本并以可复制的方式生成成百上千个图形,并且可以以EPS或TIF格式输出打印、以PNG格式或SVG格式输出放到网上、或PDF格式输出预览。使用这个图形编辑器可更改图形的任何方面,或添加标题、注释、横线、箭头和文本。
科学软件网专注提供正版软件,跟上百家软件开发商有紧密合作,价格优惠,的和培训服务。
http://turntech8843.b2b168.com