使用期限*
许可形式单机
原产地美国
介质下载
适用平台windows
科学软件网销售软件达19年,有丰富的销售经验以及客户资源,提供的产品涵盖各个学科,包括经管,仿真,地球地理,生物化学,工程科学,排版及网络管理等。此外,我们还提供很多附加服务,如:现场培训、课程、解决方案、咨询服务等。
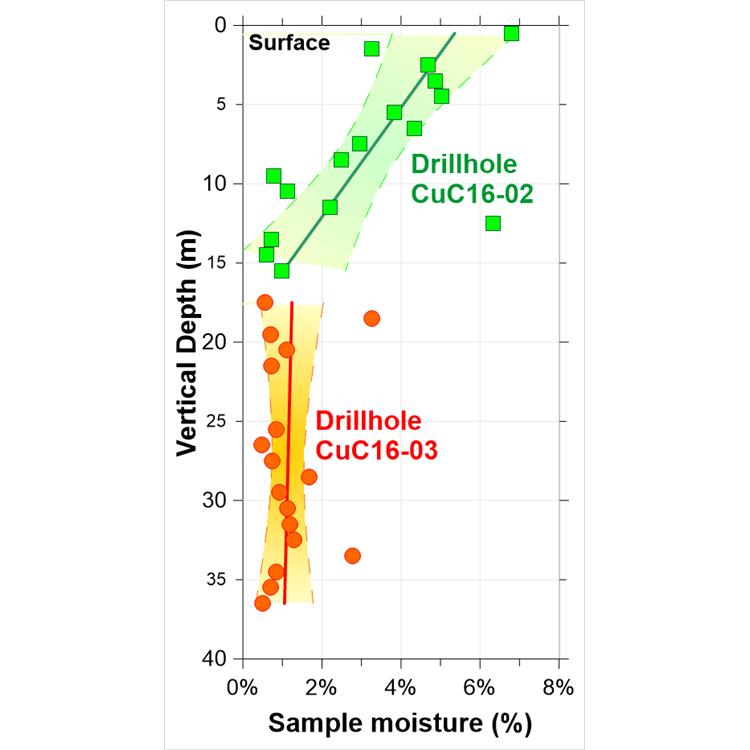
Grapher是一个功能全面的科学绘图软件包,允许用户以多种格式导入数据,创建和组合多种二维和三维图形类型,并以非常详细的方式定制这些图形。
数据可视化
好的呈现您的数据。Grapher提供70多种2D和3D绘图选项来大限度的显示数据。
分析数据
不会**数据可能隐藏的有价值信息。使用Grapher广泛的分析图表、工具和统计功能来识别趋势,找到新的见解和定位机会。Grapher提供对数据的整体视图。
轻松自动化工作
不用浪费时间重复一样的工作。创建脚本来自动执行重复性任务,并直接从Grapher任务栏中运行您喜欢的脚本。可以从任何自动化兼容的编程语言中调用Grapher,如C++,Python或Perl。Grapher可以运送脚本编写者,一个内置的Visual Basic兼容的脚本工具。更好的是,使用脚本记录器对Grapher中的脚本进行操作转换。
系统要求
Windows 7, 8 (excluding RT), 10 or higher
32-bit and 64-bit operation system support
1024 x 768 or higher monitor resolution with minimum 16-bit color depth
At least 500 MB free hard disk space
At least 512 MB RAM

Creating Graphs from the Worksheet
If you are working with the data in the worksheet, you can create a graph
without switching to the plot window. Simply select the columns you wish
to plot and choose the graph type you wish to create. To create a graph
from the worksheet:
1. Open the worksheet you wish to use for the plot or plots.
2. Highlight the columns to use in the plot or plots.
3. Click the Home tab. If you are using the Worksheet Manager, rightclick in the worksheet and select Home | New Graph from the context
menu.
4. In the New Graph group, click the Basic, Bar, Polar, Ternary,
Specialty, Statistical, or Contour Surface button. In the Worksheet
Manager, click the Basic, Bar, Polar, Ternary, Specialty,
Statistical, or Contour Surface in the context menu.

完全兼容
无缝地可视化和分析来自多个数据源的数据。Grapher可以读取多种文件格式,包括ACCDB、DBF和XLSL。Grapher还支持多种流行的输出格式。轻松管理Grapher中的数据。
自信的协助
*与同事、利益相关者和客户分析您的图表。快速输出可打印的高质量格式,如PDF或TIFF,或输出PNG或SVG格式在线共享您的工作。另外,Grapher能轻松的插入图表到演示工具中,一个简单的复制粘贴就能插入到Microsoft Word或PowerPoint中。
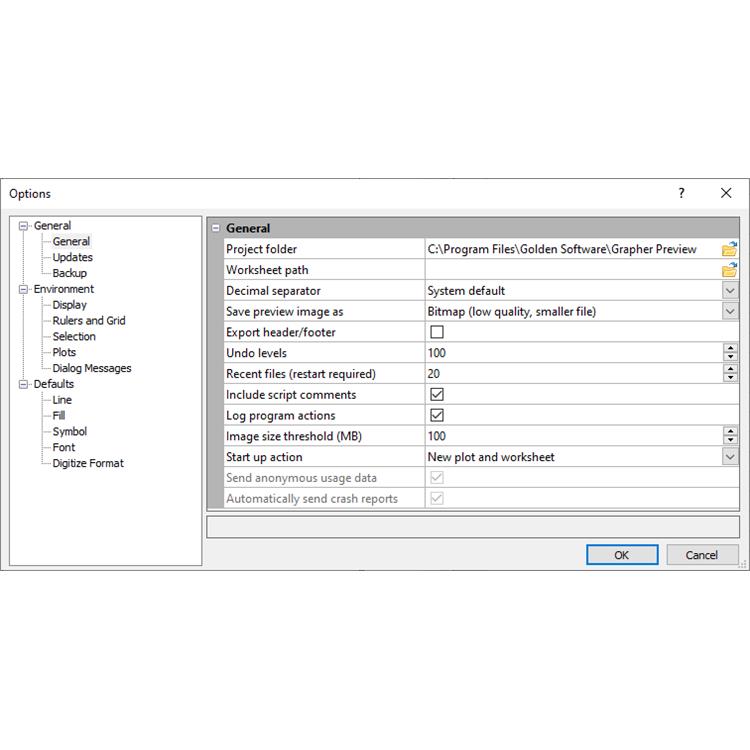
简化工作流程
Grapher的用户界面的设计可以猜测学习新程序的可能性。我们在努力的简化工作流程,节省用户的时间和精力。
Grapher用户界面的功能
单个窗口查看、编辑和操作数据和图表
对象管理可以轻松的管理图形、坐标轴和其他对象
属性管理器便于访问绘图属性
工作表窗口,以便快速查看或编辑原始数据
Dock或浮动所有管理器
定制带状布局
欢迎对话框开始您的工作
图形导航,引导您创建图形
自定义用户界面以满足您的需要

Restoring the Managers to Their Default Locations
If the managers have moved or become invisible, or if they are in
undesired locations, you can use the View | Display | Reset Windows
command to move them back to their original locations. You must restart
Grapher for the changes to take effect.
File Types
Grapher primarily uses data files and Grapher files. Grid files can be used
to create maps. Image files and vector data files can be imported into plot
documents. There are three types of Grapher files: Grapher .GRF, .GPJ,
and .GRT files. The type of file you create when saving your project should
be determined by how you wish to link the plots and their data:
2020年,北京天演融智软件有限公司申请高等教育司产学合作协同育人项目,“大数据”和“机器学习”师资培训项目,以及基于OBE的教考分离改革与教学评测项目已获得批准。我们将会跟更多的高校合作,产学融合协同育人。
http://turntech8843.b2b168.com