使用期限*
许可形式单机
原产地美国
介质下载
适用平台windows
科学软件网提供的软件上千款,涉及所有学科领域,您所需的软件,我们都能提供。科学软件网提供的软件涵盖领域包括经管,仿真,地球地理,生物化学,工程科学,排版及网络管理等。同时,还提供培训、课程(包含34款软件,66门课程)、实验室解决方案和项目咨询等服务。
Surfer适用的行业包括
农业
考古
建筑
教育
能源
环境
勘探
地球物理
程
地热
地理信息系统
海事
军事
采矿
泥浆录井
石油与天然气
可再生能源
无人机
公共事业
水利
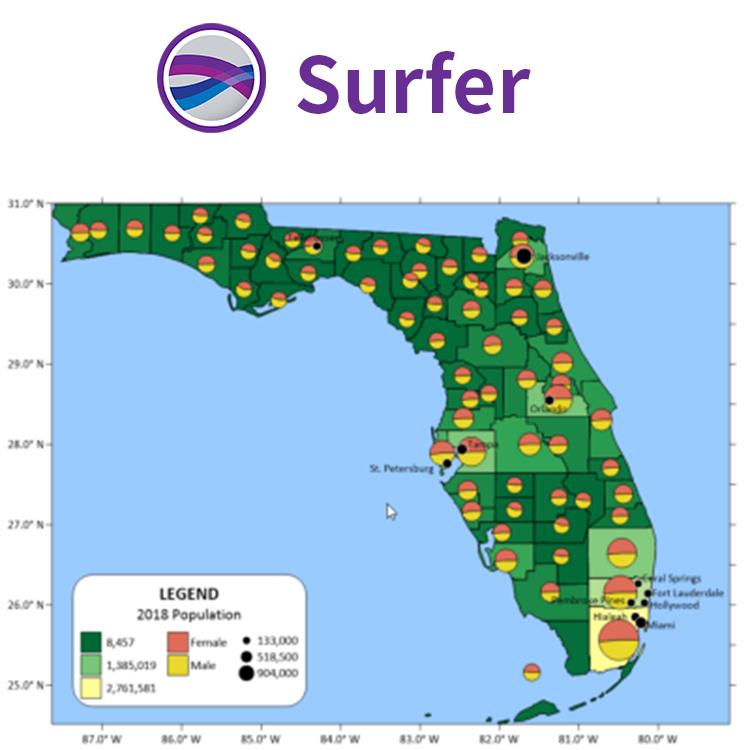
创建的地图
轻松沟通简单和复杂的空间数据。Surfer提供创建高质量地图工具,可以清楚的向同事、客户和利益相关者传统信息。
Use Data in Date/Time Format
Visualize your data with respect to time! Surfer 12 supports dates and times as v alid data. This means you can use dates and times as a data variable for gridding, for creating post maps, and you can format data in the workshe et or text labels in multiple date and time formats.
< span>
Grid and Display Maps with Logarithmic Z Scale
Effectively display Z data that range over s everal orders of magnitude! You can grid data taking the log of the Z value prior to gridding, choose to have logarithmically scaled contour levels, or h logarithmic scaling applied to the color scale. This is extremely useful when your data file has extreme data ranges, such as concentration data where t he Z values can span multiple orders of magnitude (i.e. >1 to<20000).

Enhance Maps & Models
Surfer gives you the tools to visualize and model all types of data, but it doesn’t stop there. Surfer’s extensive customization options allow you to convey complex ideas in an easy to understand manner. Enhance your maps and models with a variety of customizations options.
Surfer Customization Options
Add legends, cross sections, magnifiers, scale bars, and multiple axes
Include headers and footers
Apply linear or logarithmic color scales
Adjust tilt, rotation, and field of view angle
Edit all axis parameters
Include graticule lines or another grid
Combine or stack multiple maps
Define custom line styles and colors
Edit text, line, fill and symbol properties
Add text, polylines, polygons, symbols, and spline polylines
Include range rings
Many more…

Make Meaningful Decisions
Get answers to your questions with Surfer’s geoprocessing tools. Process your data and analyze relationships. Narrow down areas of interest, highlight important intersections, or perform mathematical calculations on the underlying data to make informed decisions.

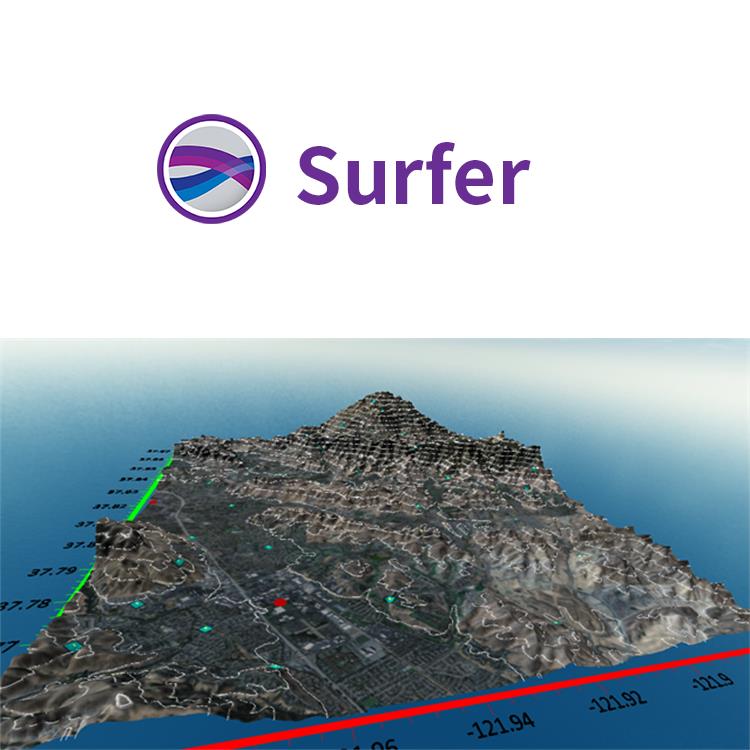
Surfer 2D/3D测绘、建模分析软件
可视化数据
使用Surfer广泛的建模工具以正确的方式显示数据,同时保持准确性和性。用Surfer可以明确的传达您的信息。
LiDAR点云
LiDAR在许多领域,包括考古学、测量学、地理信息系统等成为越来越流行的数据收集方法。使用Surfer广泛的激光处理和可视化功能,利用LiDAR提供的所有优势。
LiDAR点云功能
从多个LAS/LAZ文件中创建一个点云
通过高程、强度、返回数或分类来分配颜色
交互式或按标准选择点
、重分类或删减来选择点
从点云中创建网格或导出到LAS/LAZ
在3D视图中可视化数据的所有方面
Surfer的LAS/LAZ过滤选项
基于XY边界或高程数据限制的空间滤波
导入每个Nth点
只导入期望的返回类型或分类值
用源ID导入数据
标志过滤器,如扫描方向、飞行边缘,或合成、关键和保留点。
Export Map and Drawn Objects in One Step
Save time! Exporting map and non-map objects got a lot easier. No more complicated two-step export process. Now, simply specify the map as the scaling source when exporting your entire project to a vector or georeferenced image file– it’s that easy!
科学软件网主要提供以下科学软件服务:
1、软件培训服务:与国内大学合作,聘请业内人士定期组织软件培训,截止目前,已成功举办软件培训四十多期,累计学员2000余人,不仅让学员掌握了软件使用技巧,加深了软件在本职工作中的应用深度,而且也为**业人士搭建起了沟通的桥梁;
2、软件服务:提供软件试用版、演示版、教程、手册和参考资料的服务;
3、解决方案咨询服务:科学软件网可向用户有偿提供经济统计、系统优化、决策分析、生物制药等方面的解决方案咨询服务;
4、软件升级及技术支持服务:科学软件网可向用户提供软件的本地化技术支持服务,包括软件更新升级、软件故障排除、安装调试、培训等;
5、行业研讨服务:科学软件网会针对不**业,邀请国内外以及软件厂商技术人员,不定期在国内举办大型研讨会,时刻关注*技术,为国内行业技术发展提供导向。
http://turntech8843.b2b168.com