使用期限*
许可形式单机
原产地美国
介质下载
适用平台windows
科学软件网是一个以引进国研软件,提供软件服务的营业网站,网站由北京天演融智软件有限公司创办,旨在为国内高校、科研院所和以研发为主的企业事业单位提供的科研软件及相关软件服务。截止目前,科学软件网已获得数百家国际软件公司正式授权,代理销售科研软件达一千余种,软件涵盖领域包括经管,仿真,地球地理,生物化学,工程科学,排版及网络管理等。同时,还提供培训、课程(包含34款软件,66门课程)、实验室解决方案和项目咨询等服务。
简化工作流程
Grapher的用户界面的设计可以猜测学习新程序的可能性。我们在努力的简化工作流程,节省用户的时间和精力。
Grapher用户界面的功能
单个窗口查看、编辑和操作数据和图表
对象管理可以轻松的管理图形、坐标轴和其他对象
属性管理器便于访问绘图属性
工作表窗口,以便快速查看或编辑原始数据
Dock或浮动所有管理器
定制带状布局
欢迎对话框开始您的工作
图形导航,引导您创建图形
自定义用户界面以满足您的需要
Automate the graphing process with the included Scripter?.
Use the simple Recorder to record your graph making process! Play back scripts to create the graph with a single click!
Export graphs for use in presentations and publications in one of Grapher’s many export formats, including vector PDF, EMF, and EPS.
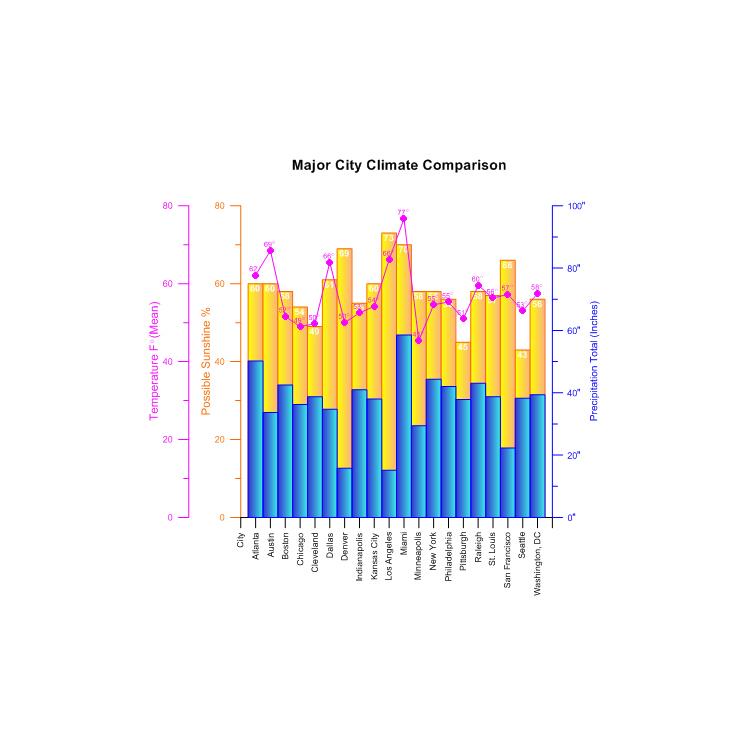
Combine multiple axes or plots to display fabulous multiple variable graphs.

The graph is created with the specified properties. You can change the
properties of a selected graph, plot, or axis through the Property Manager.
Creating Graphs in the Plot Window
The most common method of creating graphs is to use the Home | New
Graph commands. To create a graph in the plot window:
1. Click or scroll to the Home tab.
2. In the New Graph group, click the Basic, Bar, Polar, Ternary,
Specialty, Statistical, or Contour Surface plot category.
3. Click on the plot type you would like to create.
4. Select a data file in the Open Worksheet dialog and click Open. If you
are creating a contour grid map or surface grid map, you are prompted
for a .GRD file. If you are creating

Grapher是一个功能全面的科学绘图软件包,允许用户以多种格式导入数据,创建和组合多种二维和三维图形类型,并以非常详细的方式定制这些图形。

If an object contains sub-objects, a or displays to the left of the object
name. Click the or icon to expand or collapse the list. For example, a
graph object contains a plot, e.g., line/scatter, plus at least two axes. To
expand the tree, click on the icon, select the item and press the plus key
(+) on the numeric keypad, or press the right arrow key on your keyboard.
To collapse a branch of the tree, click on the icon, select the item and
press the minus key (-) on the numeric keypad, or press the left arrow
key.
Click on the object name to select an object and display its properties in
the Property Manager. The plot window updates to show the selected
object with a selection bounding box and the status bar displays the name
of the selected object. To select multiple objects, hold down the CTRL key
and click on each object. To select multiple adjacent objects at the same
level in the tree, click on the first object's name, hold down the SHIFT key,
and then click on the last object's name.
科学软件网为全国大多数高校提供过产品或服务,销售和售后团队,确保您售后**!
http://turntech8843.b2b168.com


