使用期限*
许可形式单机和网络版
原产地美国
介质下载
适用平台windows,mac
科学软件网提供的软件上千款,涉及所有学科领域,您所需的软件,我们都能提供。科学软件网提供的软件涵盖领域包括经管,仿真,地球地理,生物化学,工程科学,排版及网络管理等。同时,还提供培训、课程(包含34款软件,66门课程)、实验室解决方案和项目咨询等服务。
Mplus是一款统计建模程序,给研究人员提供了一个灵活的分析数据的工具。Mplus界面简单、数据和分析结果以图形显示,为研究人员提供广泛的模型、估计和算法的选择。Mplus允许进行横截面和纵向、单级和多级数据分析;来自不同人群的观测数据或未观测到的异质性数据,以及包含缺失值的数据都可以进行分析。可以对连续、删失、二进制、有序分类(序数)、无序类别(计数)、计数或这些变量类型的组合观测变量都可以进行分析。此外,Mplus还具有广泛的蒙特卡罗模拟功能,程序中包含的任何模型,都可以生成和分析数据。
Mplus的建模框架借鉴了潜变量的统一主题。而且一般的建模框架来自连续和分类潜变量的使用。连续潜变量用于表示与未观测到的构造相对应的因素,随机效应与发展中的个体差异相对应,随机效应与分层数据中各组间系数变化相对应,弱点对应于生存时间的异质性,责任与疾病遗传易感性相对应,潜在响应变量值与缺失数据相对应。分类潜变量对应于均质个体群,潜在的轨迹分类对应于未观测种群的发展类型,混合组件对应于未观测种群的有限混合,潜在响应变量类别对应于缺失数据。
Mplus Base Program and Combination Add-On
Mplus Base Program and Combination Add-On包含了Mplus Base Program and the Mixture and Multilevel Add-Ons的所有功能。此外,它还包括处理同一模型中的集群数据和潜在类的模型。例如,两级回归混合分析、二级混合验证因子分析(CFA)和结构方程模型(SEM)、二级潜类分析、多层增长混合模型、二级离散和连续时间生存混合分析。其他功能包括缺失数据估计;复杂的调查数据分析,包括分层、聚类和不平等的选择概率(抽样权重);用较大似然法分析潜在变量相互作用和非线性因素;随机斜率;个体变化的观测次数;非线性参数约束;所有结果类型的较大似然估计。贝叶斯分析与多重归责原则;蒙特卡罗模拟功能以及后处理图形模型。
适用平台
Microsoft Windows 7/8/10
Mac OS X 10.8或更高版本
Linux (已在下面的平台中测试过: Ubuntu, RedHat, Fedora, Debian和Gentoo)
至少1GB以上的内存
至少120 MB硬盘空间

New version of Mplus Web Note 21 with a new section 8 discussing 3-step and BCH methods for RI-LTA: Auxiliary variables in mixture modeling: Using the BCH method in Mplus to estimate a distal outcome model and an arbitrary secondary model.

Free Mplus workshops - Dr. Michael Zyphur has made available a free 3-day workshop held in July 2019 at the University of Melbourne. The workshop covers the new General Cross-Lagged Panel Model (GCLM) in Mplus. A second course will be offered sometime between Nov 25 and Dec 13, 2019. Additionally, a 5-day Mplus workshop covering various modeling topics, from basic correlation and regression to multilevel structural equation modeling and latent growth models in Mplus is available for viewing and download.

The Mplus Modeling Framework
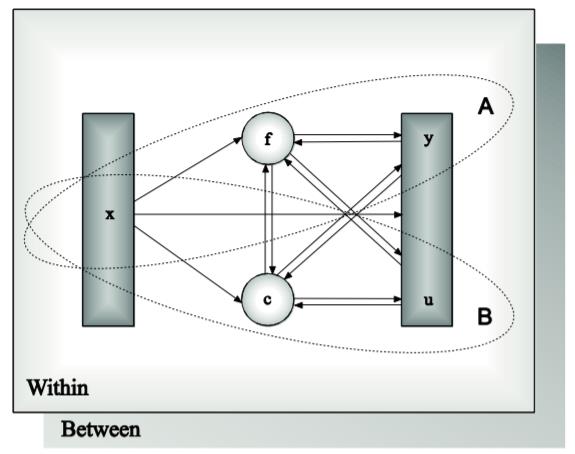
The purpose of modeling data is to describe the structure of data in a simple way so that it is understandable and interpretable. Essentially, the modeling of data amounts to specifying a set of relationships between variables. The figure below shows the types of relationships that can be modeled in Mplus. The rectangles represent observed variables. Observed variables can be outcome variables or background variables. Background variables are referred to as x; continuous and censored outcome variables are referred to as y; and binary, ordered categorical (ordinal), unordered categorical (nominal), and count outcome variables are referred to as u. The circles represent latent variables. Both continuous and categorical latent variables are allowed. Continuous latent variables are referred to as f. Categorical latent variables are referred to as c.
2020年,北京天演融智软件有限公司申请高等教育司产学合作协同育人项目,“大数据”和“机器学习”师资培训项目,以及基于OBE的教考分离改革与教学评测项目已获得批准。我们将会跟更多的高校合作,产学融合协同育人。
http://turntech8843.b2b168.com


