使用期限*
许可形式单机
原产地美国
介质下载
适用平台windows
科学软件网提供的软件覆盖各个学科,软件数量达1000余款,满足各高校和企事业单位的科研需求。此外,科学软件网还提供软件培训和研讨会服务,目前视频课程达68门,涵盖34款软件。
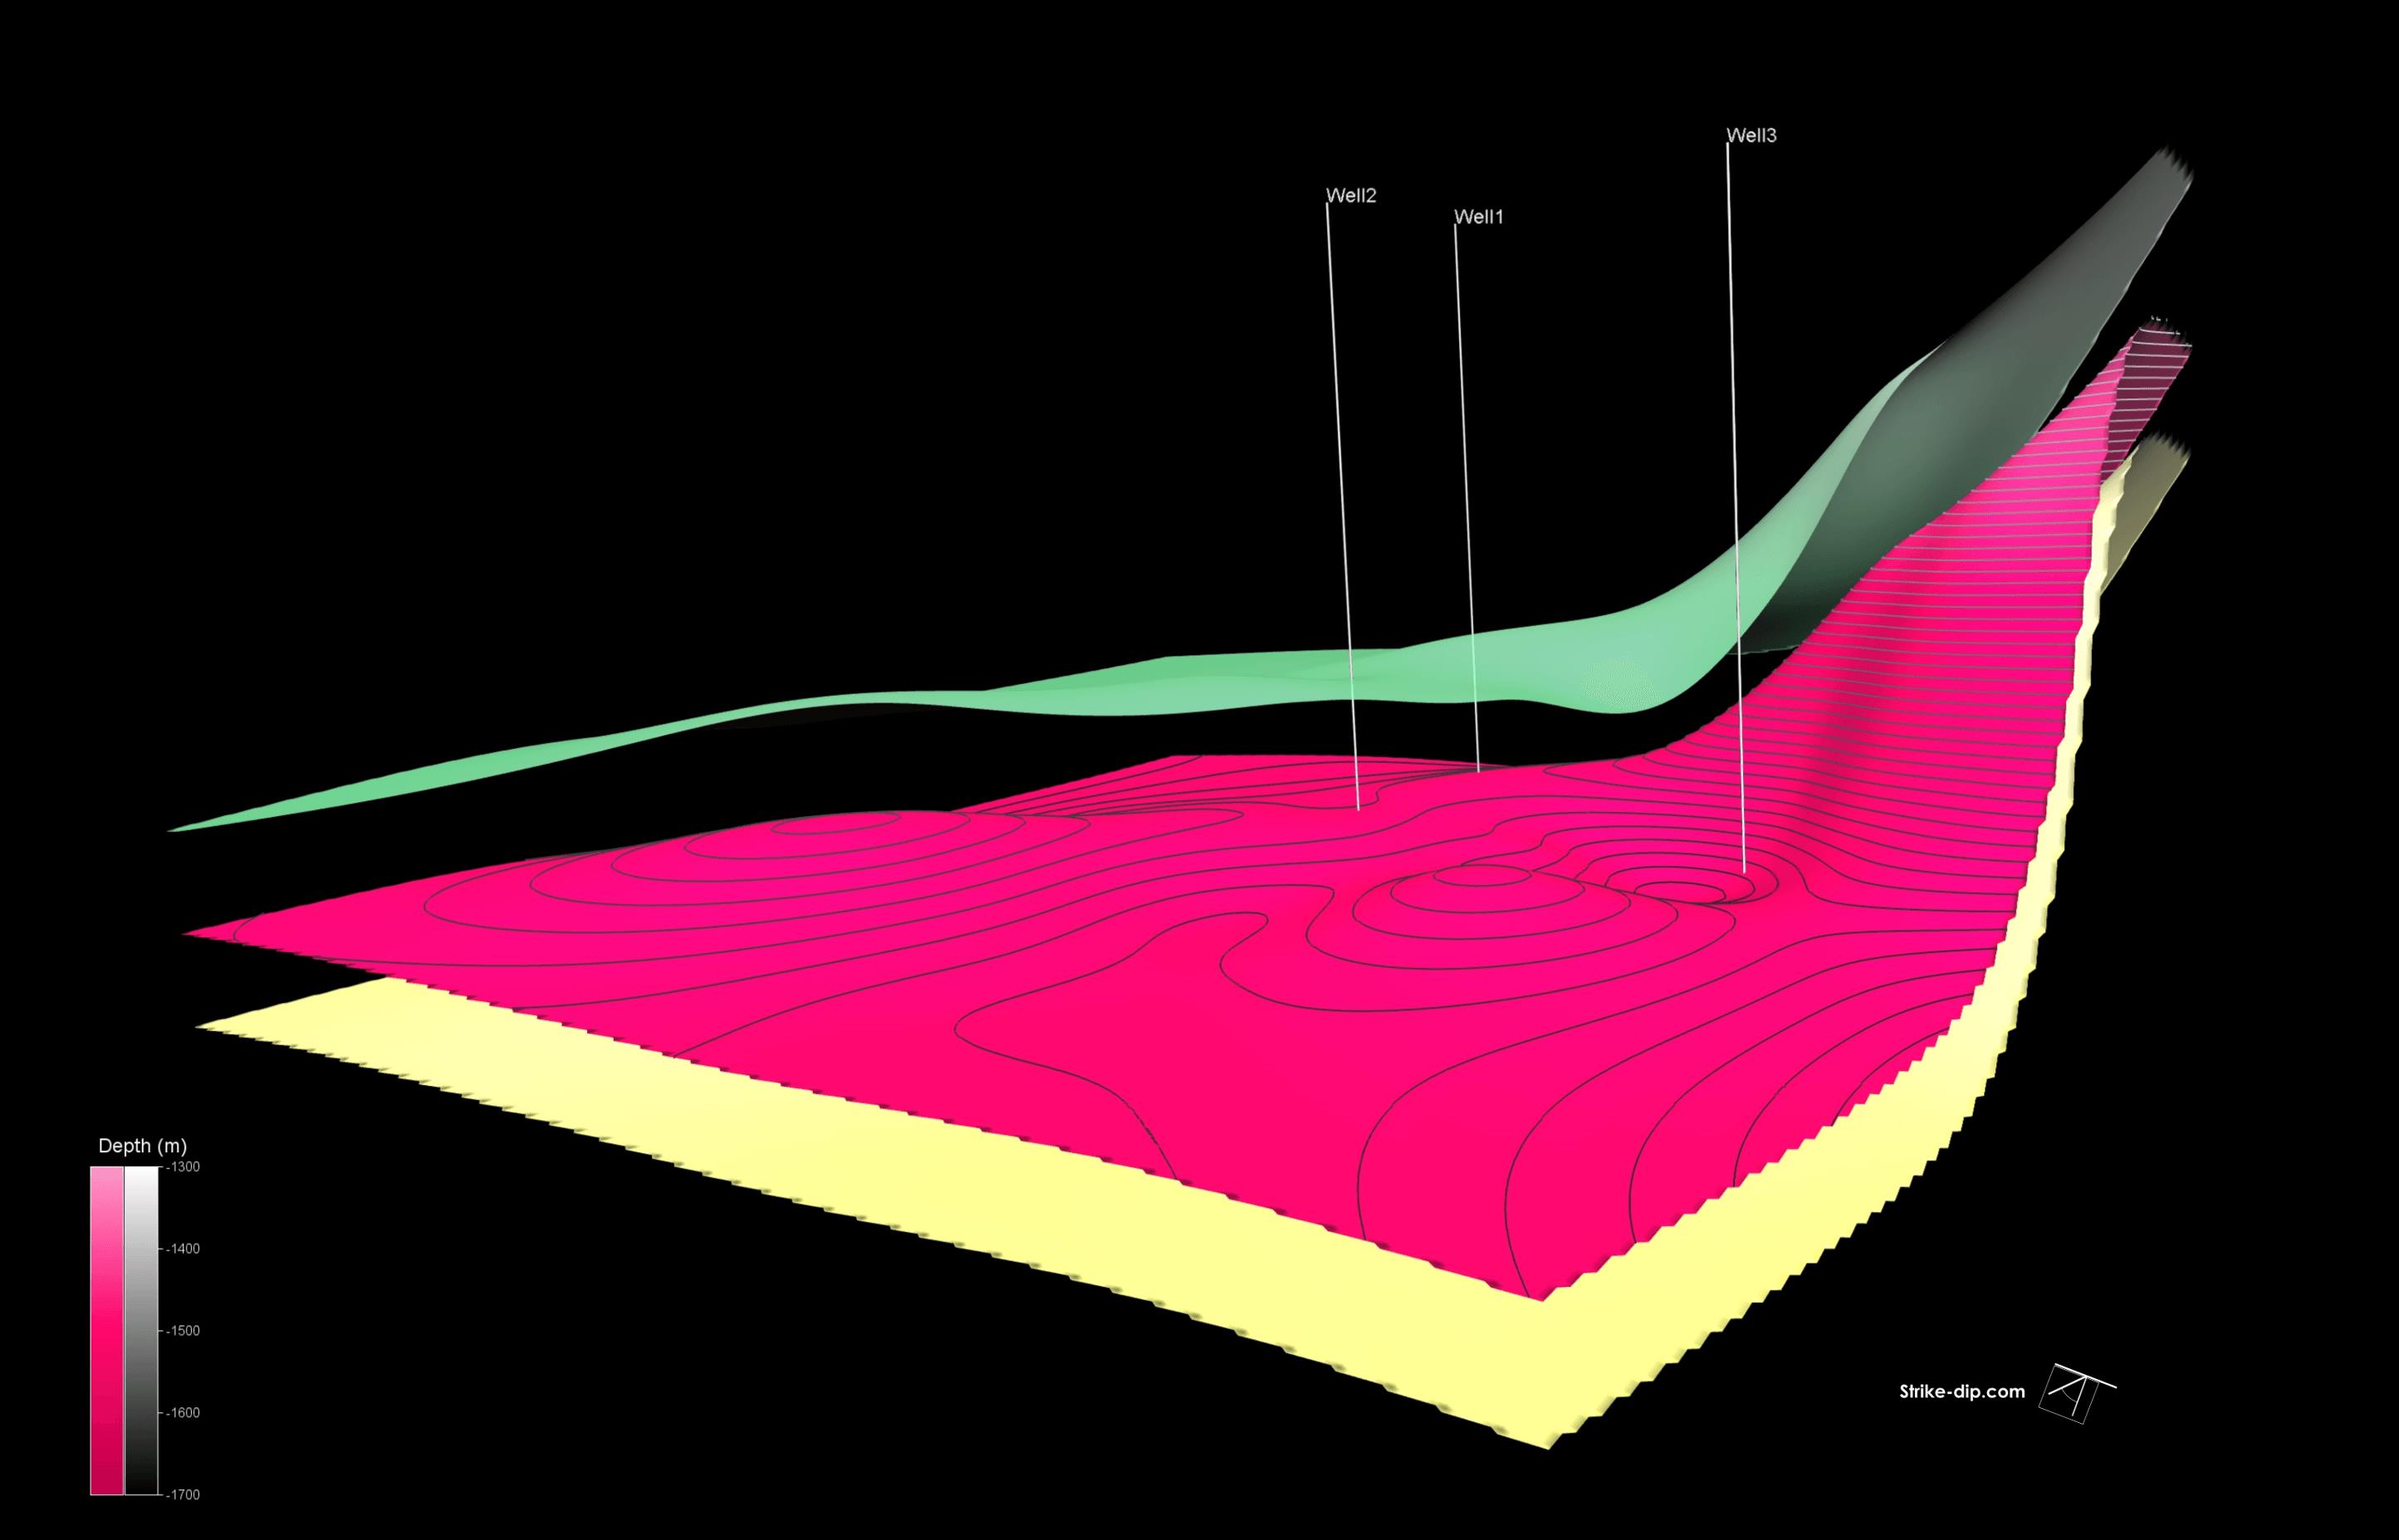
网格数据确定
对您的模型的准确性完全有信心。Voxler将从您的定期或不规则的3D数据中生成一个统一的3D点阵。利用度量计算,包括数据顺序统计,深入数据的细节(小值、下四分位数、中位数、上四分位数、大值、中值、中位数、四分位数范围),矩统计量(均值、标准差、方差、变异系数、总和),其他统计数据(均方根、中位偏差)和位置统计(计数、密度、近距离、远距离、平均距离、平均距离)。
Voxler插值功能
网格法:逆距离和局部多项式
过滤,排除数据
在晶格上执行数算
转换、合并、重采样格
提取格的子集或切片
完全兼容
无缝地可视化和分析来自多个来源的数据。Voxler在本地阅读大量的文件格式,包括AutoCad DXF和激光。Voxler还支持所有流行的导出格式。Voxler简化了建模工作流程。
自信协助
与利益相关者、客户和同事快速共享模型。模型已准备好打印格式的高质量格式,如PDF或TIFF,或者通过它们导出到PNG或SVG格式来共享您的工作。使用简单的复制和粘贴,或者更动态的视图,用Voxler的内置视频工具捕获视频,很*将图表插入到诸如微软Word或PowerPoint等演示工具中。
Height Field
A height field displays data values as colors for a 2D grid, a 2D orthogonal slice of a uniform 3D grid, or along a 2D curvilinear lattice. The data magnitude is also depicted by the amount of displacement above or below the slice. The displacement is perpendicular to the plane or curvilinear lattice and is adjusted by the scale factor.
Stream Lines
Stream lines are used to display the path of particles through a velocity field, the distribution of velocities of a medium in 3D space. Different colors indicate the magnitude of the velocities.
A vector plot displays lines or arrows indicating the direction and magnitude indicated by the components of a 3D grid or point data set. The magnitude of the vectors is shown by length and color.
Scatter Plot
A scatter plot displays symbols at the XYZ location specified in the data file. If the data file has a value at each data point, specify different colors for different data values.
Enhance Models
Present your data at its best with Voxler’s numerous customization options. Control every aspect of your model down to the smallest details so you can convey complex ideas in an easy to understand manner.
Voxler Customization Options
Titles, axes, scale bars
Legends, profiles, cross sections
Edit all axis parameters, include multiple axes
Combine multiple models
Slice models at any angle
Insert clip planes and bounding boxes
Full control over opacity, lighting, and texture options
Edit text, line, fill and symbol properties
Add text, polylines, polygons, symbols, and spline polylines
Include georeferenced images
Many more…

谁应该使用Voxler
环境人员分析地下水和土壤污染场地
研究三维地震和微粒子数据的地球科学家
GIS人员需要在真正的3D空间中显示数据
地质技术人员建模CPT或GPR数据
气象学家编译大气研究
生物学家进行生物采样
海洋学家评估水温、污染物和盐度调查
地震学家建模速度
任何需要看3D数据分布的人

智能工作,轻松自动化
不要浪费时间一遍又一遍地做同样的事情。创建用于自动化重复任务的脚本。Voxler可以从任何与自动化兼容的编程语言中调用,如C++、Python或Perl。Voxler还附带了脚本,这是一种内置的可视化基本兼容脚本工具。使用自动化节省时间,通过查看Voxler自动化知识库*量的样例脚本,节省更多的时间。
科学软件网不定期举办各类公益培训和讲座,让您有更多机会免费学习和熟悉软件。
http://turntech8843.b2b168.com


