使用期限租赁和*
许可形式单机和网络版
原产地美国
介质下载
适用平台windows,mac,linux
科学软件网销售软件达19年,有丰富的销售经验以及客户资源,提供的产品涵盖各个学科,包括经管,仿真,地球地理,生物化学,工程科学,排版及网络管理等。此外,我们还提供很多附加服务,如:现场培训、课程、解决方案、咨询服务等。
MATLAB® helps geoscientists understand the dynamics, preconditions, and trends related to Earth, the ocean, and the atmosphere. You can use MATLAB for projects such as studying climate change's impact on global coral reefs, analyzing seismic activity, or modeling water flow. MATLAB can help whether you’re collecting data from the field or from facilities such as IRIS's Data Managment Center.
Analyze and visualize your data using techniques such as statistics, ** processing, image processing, and mapping. With MATLAB, you can build and simulate models of past and future environmental events.
Work with a variety of data sources to access and analyze data from peer research, government- and university-funded data facilities, and other software packages. Synthesize flawed and large data, collaborate across universities and institutions, and access computing resources for large-scale analyses and simulations.
Explore community toolboxes and apps on File Exchange and GitHub®, where researchers often publish code artifacts tied to innovative scientific findings.

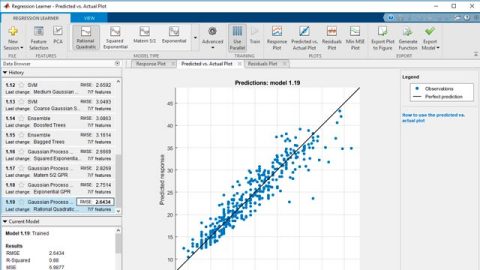
With MATLAB® and related data analysis products you perform analyses and gain insight into your data in a fraction of the time required with spreadsheets or traditional programming languages such as C, C++, or Visual Basic.
These products combine a powerful numeric engine and programming environment with interactive tools for statistical analysis, image processing, ** processing, and other domains. You can:
Access data from files, spreadsheets, databases, test equipment, data acquisition hardware, other software, or the Web
Explore your data to identify trends, test hypotheses, and estimate uncertainty
Create customized algorithms, visualizations, and models and publish customized reports
Share your analysis tools as MATLAB code or as standalone desktop or Web applications
设计和仿真调度逻辑
Stateflow 能够对控制系统中的调度逻辑进行建模、设计和模拟,以安排控制器的运转、控制系统的操作模式并执行故障检测、隔离与恢复 (FDIR)。
使用图形编辑器以状态机或流程图的形式构建逻辑。还可以将图形表示法和表格表示法(包括状态转换图、流程图、状态转换表和真值表)结合在一起,针对系统对事件、基于时间的条件以及外部输入信号的反应方式进行建模。通过使用状态图动画**显示模型中的活动状态和转移,来实现系统仿真行为的可视化。
将设计部署到嵌入式控制器
控制系统算法经过设计之后,便可以加以优化以便进行实施。您可以使用**算法设计的**数据类型属性,为实施做好准备。在闭环桌面仿真过程中验证控制算法之后,通过自动生成 C、结构化文本或 HDL 代码,将它们部署到生产微控制器、PLC 和 FPGA。
可以继续测试和验证控制系统。通过在嵌入式控制器上运行控制算法,以及在连接到控制器上的目标计算机上实时运行对象模型,来执行硬件在环 (HIL) 测试。可以使用形式化验证方法进一步验证和测试控制系统。

HDL 就绪模型和示例
使用高层级模块构建设计,仿真算法的硬件实现并生成高质量的 HDL 代码。模块包括数学、三角学、数字信号处理、无线通信,以及视频和图像处理。您可以使用子系统级IP
进行 LTE 无线和视觉处理
Fixed-Point 简化操作
自动实现浮点到**的数据类型转换过程,以便FPGA硬件实现。在资源使用和度之间实现平衡。
如果您要实现高精度或高动态范围的计算,或者希望在转换为**之前生成原型,那么可以生成可综合、与目标无关的原生浮点 HDL。
自动执行 FPGA 和 SoC 原型开发
对于 Xilinx®、Intel®、Microsemi® 和 Speedgoat 等深受欢迎的 FPGA 和 SoC 原型开发平台,您只需按下一个按钮,即可生成设备编程所需的一切。原型可以作为立设备运行,也可以连接到 MATLAB 或 Simulink 进行激励和调试。之后,您可以将其重复用于任何 FPGA、ASIC 或 SoC 上的产品实现。 另外,您还可以为简单的编程设置定制的原型板。
重用模型和测试以进行验证
将 MATLAB Simulink 模型将,以及 Mentor Graphics® 或 Cadence® 仿真器中运行的手写或生成的 HDL 进行联合仿真。然后将这些模型和测试导出为适用于 UVM 或自定义验证环境的 SystemVerilog DPI-C 组件。
2020年,北京天演融智软件有限公司申请高等教育司产学合作协同育人项目,“大数据”和“机器学习”师资培训项目,以及基于OBE的教考分离改革与教学评测项目已获得批准。我们将会跟更多的高校合作,产学融合协同育人。
http://turntech8843.b2b168.com