使用期限租赁或*
许可形式单机和网络版
原产地美国
介质下载
适用平台window,mac,linux
科学软件网提供的软件覆盖各个学科,软件数量达1000余款,满足各高校和企事业单位的科研需求。此外,科学软件网还提供软件培训和研讨会服务,目前视频课程达68门,涵盖34款软件。
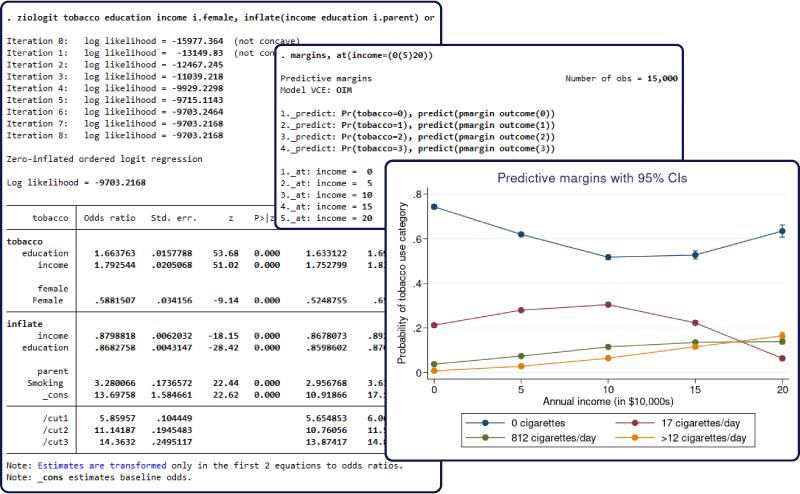
Nonparametric series regression
Stata 16's new npregress series command fits nonparametric series regressions that approximate the mean of the dependent variable using polynomials, B-splines, or splines of the covariates. This means that you do not need to specify any predetermined functional form. You specify only which covariates you wish to include in your model. For instance, type
. npregress series wineoutput rainfall temperature i.irrigation
Instead of reporting coefficients, npregress series reports effects, meaning average marginal effects for continuous variables and contrasts for categorical variables. The results might be that the average marginal effect of rainfall is 1 and the contrast for irrigation is 2. This contrast can be interpreted as the average treatment effect of irrigation.
Being a nonparametric regression, the unknown mean is approximated by a series function of the covariates. And yet we can still obtain the inferences that we could from a parametric model. We use margins. We could type
. margins irrigation, at(temperature=(40(5)90))
and obtain a table of the expected effect of having irrigation at temperatures of 40, 50, ..., 90 degrees. And we could graph the result using marginsplot.
Even more, npregress series can fit partially parametric (semiparametric) models.
Frequentist analysis is entirely data-driven and strongly depends on whether or not the data
assumptions required by the model are met. On the other hand, Bayesian analysis provides a more
robust estimation approach by using not only the data at hand but also some existing information or
knowledge about model parameters.
In frequentist statistics, estimators are used to approximate the true values of the unknown parameters,
whereas Bayesian statistics provides an entire distribution of the parameters. In our example of a
prevalence of an infectious disease from What is Bayesian analysis?, frequentist analysis produced one
point estimate for the prevalence, whereas Bayesian analysis estimated the entire posterior distribution
of the prevalence based on a given sample.
完整的数据管理功能
Stata的数据管理功能让您控制所有类型
的数据。
您可以重组数据,管理变量,并收集各组
并重复统计。您可以处理字节,整数,long,
float,double和字符串变量(包括BLOB和达到
20亿个字符的字符串)。Stata还有一些
的工具用来管理的数据,如生存/时间数
据、时间序列数据、面板/纵向数据、分类数
据、多重替代数据和调查数据。
出版质量的图形
Stata轻松生成出版质量、风格迥异的图形。您可以编写脚本并以可复制的方式生成成百上千个图形,并且可以以EPS
或TIF格式输出打印、以PNG格式或SVG格式输出放到网上、或PDF格式输出预览。使用这个图形编辑器可更改图形的任何
方面,或添加标题、注释、横线、箭头和文本。

Description
This entry provides a software-free introduction to Bayesian analysis. See [BAYES] bayes for an
overview of the software for performing Bayesian analysis and for an overview example.
科学软件网不定期举办各类公益培训和讲座,让您有更多机会免费学习和熟悉软件。
http://turntech8843.b2b168.com