-

北京天演融智软件有限公司
主营:pscad,gams,spsspro,stata,matlab,mathematica,nvivo

北京天演融智软件有限公司
主营:pscad,gams,spsspro,stata,matlab,mathematica,nvivo 8
8

科学软件网是一个以引进国研软件,提供软件服务的营业网站,网站由北京天演融智软件有限公司创办,旨在为国内高校、科研院所和以研发为主的企业事业单位提供的科研软件及相关软件服务。截止目前,科学软件网已获得数百家国际软件公司正式授权,代理销售科研软件达一千余种,软件涵盖领域包括经管,仿真,地球地理,生物化学,工程科学,排版及网络管理等。同时,还提供培训、课程(包含34款软件,66门课程)、实验室解决方案和项目咨询等服务。
Description
This entry provides a software-free introduction to Bayesian analysis. See [BAYES] bayes for an
overview of the software for performing Bayesian analysis and for an overview example.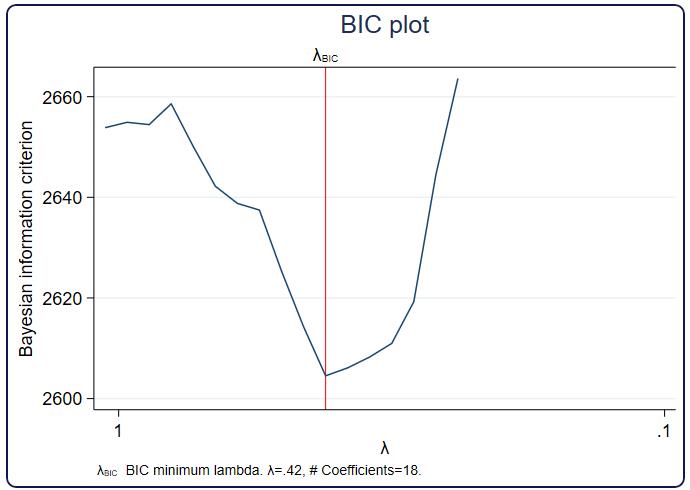
Stata 16 has a new suite of commands for performing meta-analysis. This suite lets you explore and combine the results from different studies. For instance, if you have collected results from 20 studies about the effect of a particular drug on blood pressure, you can summarize these studies and estimate the overall effect using meta-analysis.
The new meta suite is broad, but what sets it apart is its simplicity.
You can type, for instance,
. meta set effectsize stderr
to declare precomputed effect sizes or use meta esize to compute effects from summary data. With this, you can perform random-effects, fixed-effects, or common-effect meta-analysis.
To estimate an overall effect size and its confidence interval, obtain heterogeneity statistics, and more, you simply type
. meta summarize
And visualizing the results is as easy as typing
. meta forestplot
But the meta suite provides much more.
Meta-regression and subgroup analysis allow you to evaluate the heterogeneity of studies. These are available via meta regress and meta forestplot, subgroup() or meta summarize, subgroup().
You can investigate potential publication bias. Check visually for funnel-plot asymmetry using meta funnelplot; formally test for funnel-plot asymmetry using meta bias; and assess publication bias using the trim-and-fill method with meta trimfill.
You can even perform cumulative meta-analysis with meta summarize, cumulative().
All the meta-analysis features are documented in the new Meta-analysis Reference Manual.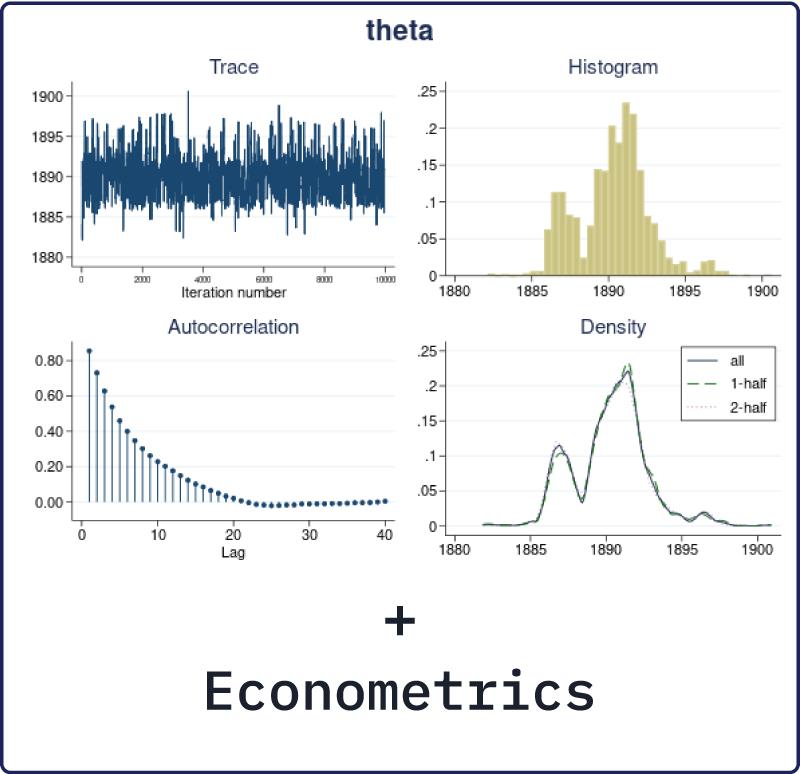
Nonparametric series regression
Stata 16's new npregress series command fits nonparametric series regressions that approximate the mean of the dependent variable using polynomials, B-splines, or splines of the covariates. This means that you do not need to specify any predetermined functional form. You specify only which covariates you wish to include in your model. For instance, type
. npregress series wineoutput rainfall temperature i.irrigation
Instead of reporting coefficients, npregress series reports effects, meaning average marginal effects for continuous variables and contrasts for categorical variables. The results might be that the average marginal effect of rainfall is 1 and the contrast for irrigation is 2. This contrast can be interpreted as the average treatment effect of irrigation.
Being a nonparametric regression, the unknown mean is approximated by a series function of the covariates. And yet we can still obtain the inferences that we could from a parametric model. We use margins. We could type
. margins irrigation, at(temperature=(40(5)90))
and obtain a table of the expected effect of having irrigation at temperatures of 40, 50, ..., 90 degrees. And we could graph the result using marginsplot.
Even more, npregress series can fit partially parametric (semiparametric) models.
anyvalue(), anymatch(), and anycount() are for categorical or other variables taking integer
values. If we define a subset of values specified by an integer numlist (see [U] 11.1.8 numlist),
anyvalue() extracts the subset, leaving every other value missing; anymatch() defines an indicator
variable (1 if in subset, 0 otherwise); and anycount() counts occurrences of the subset across a set
of variables. Therefore, with one variable, anymatch(varname) and anycount(varname) are
equivalent.
With the auto dataset, we can generate a variable containing the high values of rep78 and a
variable indicating whether rep78 has a high value:
2020年,北京天演融智软件有限公司申请高等教育司产学合作协同育人项目,“大数据”和“机器学习”师资培训项目,以及基于OBE的教考分离改革与教学评测项目已获得批准。我们将会跟更多的高校合作,产学融合协同育人。
http://turntech8843.b2b168.com
欢迎来到北京天演融智软件有限公司网站, 具体地址是北京市海淀区北京市海淀区上地东路35号院1号楼3层1-312-318、1-312-319,老板是赵亚君。
主要经营北京天演融智软件有限公司(科学软件网)主营产品PSCAD, CYME, SPSSPRO, Stata, Matlab,GAMS,Hydrus,GMS,Visual Modflow 等各学科软件,科学软件网有20多年的软件销售经验,提供专业销售和培训服务,还有更多的增值服务。目前,科学软件网提供的软件有数百种,软件涵盖的领域包括,经管,仿真,地球地理,生物化学,工程科学,排版及网络管理等各个学科。。
单位注册资金单位注册资金人民币 1000 - 5000 万元。
我们的产品优等,服务优质,您将会为选择我们而感到放心,我们将会为得到您认可而感到骄傲。