使用期限租赁或*
许可形式单机和网络版
原产地美国
介质下载
适用平台window,mac,linux
科学软件网提供的软件覆盖各个学科,软件数量达1000余款,满足各高校和企事业单位的科研需求。此外,科学软件网还提供软件培训和研讨会服务,目前视频课程达68门,涵盖34款软件。
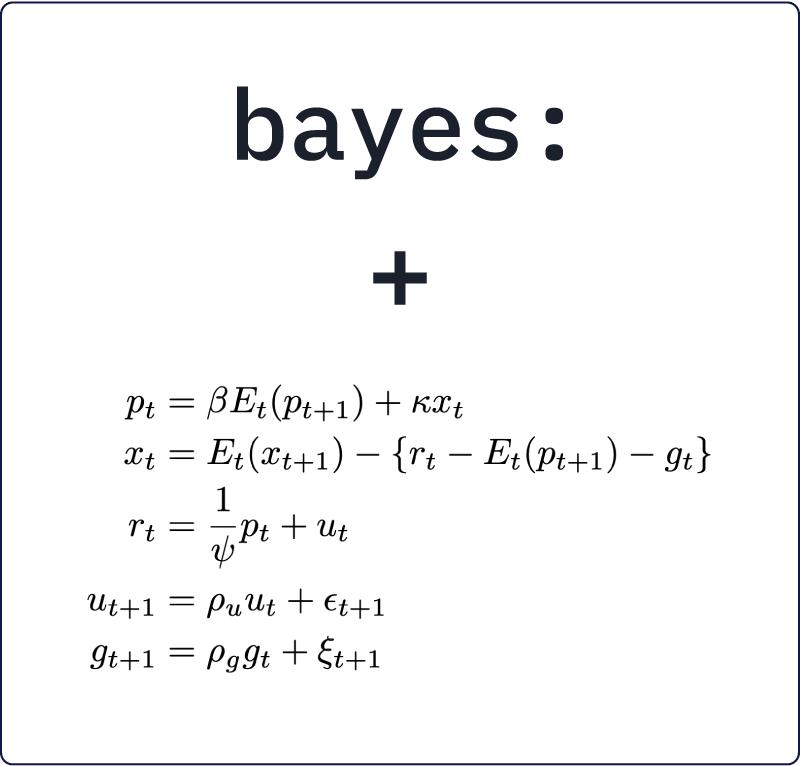
Nonlinear DSGE models in Stata 15
In Stata 15, we introduced the dsge command for fitting linear DSGE models, which are time-series models used in economics and finance. These models are an alternative to traditional forecasting models. Both attempt to explain aggregate economic phenomena, but DSGE models do this on the basis of models derived from microeconomic theory.
New in Stata 16, the dsgenl command fits nonlinear DSGE models. Most DSGE models are nonlinear, and this means that you no longer need to linearize them by hand. When you enter equations into dsgenl, it linearizes them for you.
After estimating the parameters of your model with dsgenl, you can obtain the transition and policy matrices; determine the model’s steady state; estimate variables’ variances, covariances, and autocovariances implied by the system of equations; and create and graph impulse–response functions.
This is likely to be the favorite feature of macroeconomists and anyone working in a central bank.
The fill() and seq() functions are alternatives. In essence, fill() requires a minimal example
that indicates the kind of sequence required, whereas seq() requires that the rule be specified through
options. There are sequences that fill() can produce that seq() cannot, and vice versa. fill()
cannot be combined with if or in, in contrast to seq(), which can.
Remarks and examples
Remarks are presented under the following headings:
What is Bayesian analysis?
Bayesian versus frequentist analysis, or why Bayesian analysis?
How to do Bayesian analysis
Advantages and disadvantages of Bayesian analysis
Brief background and literature review
Bayesian statistics
Posterior distribution
Selecting priors
Point and interval estimation
Comparing Bayesian models
Posterior prediction
Bayesian computation
Markov chain Monte Carlo methods
Metropolis–Hastings algorithm
Adaptive random-walk Metropolis–Hastings
Blocking of parameters
Metropolis–Hastings with Gibbs updates
Convergence diagnostics of MCMC
Summary
The first five sections provide a general introduction to Bayesian analysis. The remaining sections
provide a more technical discussion of the concepts of Bayesian analysis.
Stata是一款完整的、集成的统计软件包,提供您需要的一切数据分析、数据管理和图形。
快速,简单并易于使用
点击式的界面和强大,直观的命令语言让Stata使用起来快速,并易于使用。
所有的分析结果都可以被复制和存档,并用来出版和审查。不管您什么时候写的内容,版本控制系统确保统计程序可继续生成同样的结果。
Stata的作图模块,主要提供如下八种基本图形的制作 : 直方图(histogram),条形图(bar),百分条图 (oneway),百分圆图(pie),散点图(two way),散点图矩阵(matrix),星形图(star),分位数图。这些图形的巧妙应用,可以满足绝大多数用户的统计作图要求。在有些非绘图命令中,也提供了绘制某种图形的功能,如在生存分析中,提供了绘制生存曲线图,回归分析中提供了残差图等。
Stata的矩阵运算功能
矩阵代数是多元统计分析的重要工具, Stata提供了多元统计分析中所需的矩阵基本运算,如矩阵的加、积、逆、 Cholesky分解、 Kronecker内积等;还提供了一些运算,如特征根、特征向量、奇异值分解等;在执行完某些统计分析命令后,还提供了一些系统矩阵,如估计系数向量、估计系数的协方差矩阵等。
统计功能
Stata使得大量的统计工具用于指尖
标准方法,如
基本表格和总结
案例对照分析
ARIMA
ANOVA 和MANOVA
线性回归
时间序列平滑
广义线性模型(GLM)
聚类分析
对比和比较
功率分析
样本选择
……
方法,如
多层模型
生存分析
动态面板数据回归
结构方程建模
二进制,计数和审查结果
ARCH
多重替代法
调查数据
Treatment effects
统计
贝叶斯分析
……
科学软件网不仅提供软件产品,更有多项附加服务免费提供,让您售后**!
http://turntech8843.b2b168.com


