使用期限租赁或*
许可形式单机和网络版
原产地美国
介质下载
适用平台window,mac,linux
科学软件网提供的软件上千款,涉及所有学科领域,您所需的软件,我们都能提供。科学软件网提供的软件涵盖领域包括经管,仿真,地球地理,生物化学,工程科学,排版及网络管理等。同时,还提供培训、课程(包含34款软件,66门课程)、实验室解决方案和项目咨询等服务。
New reporting features in Stata 16:
• The dyndoc and markdown commands now create Word documents in addition to the HTML documents they previously created. Now, you can easily incorporate full Stata output and graphs with Markdown-formatted text to create customized Word documents.
• The Do-file Editor now provides syntax highlighting for Markdown language elements.
• The putdocx command now lets you include headers, footers, and page numbers. It also makes it easier to write large blocks of text.
• The html2docx command converts HTML documents, including CSS, to Word documents.
• The docx2pdf command converts Word documents to PDFs.

Stata 16 has a new suite of commands for performing meta-analysis. This suite lets you explore and combine the results from different studies. For instance, if you have collected results from 20 studies about the effect of a particular drug on blood pressure, you can summarize these studies and estimate the overall effect using meta-analysis.
The new meta suite is broad, but what sets it apart is its simplicity.
You can type, for instance,
. meta set effectsize stderr
to declare precomputed effect sizes or use meta esize to compute effects from summary data. With this, you can perform random-effects, fixed-effects, or common-effect meta-analysis.
To estimate an overall effect size and its confidence interval, obtain heterogeneity statistics, and more, you simply type
. meta summarize
And visualizing the results is as easy as typing
. meta forestplot
But the meta suite provides much more.
Meta-regression and subgroup analysis allow you to evaluate the heterogeneity of studies. These are available via meta regress and meta forestplot, subgroup() or meta summarize, subgroup().
You can investigate potential publication bias. Check visually for funnel-plot asymmetry using meta funnelplot; formally test for funnel-plot asymmetry using meta bias; and assess publication bias using the trim-and-fill method with meta trimfill.
You can even perform cumulative meta-analysis with meta summarize, cumulative().
All the meta-analysis features are documented in the new Meta-analysis Reference Manual.

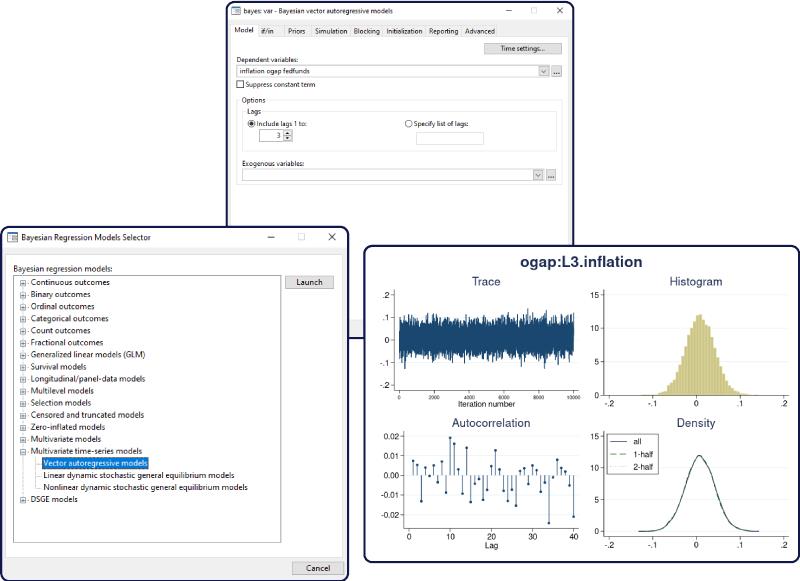
In Bayesian analysis, we can use previous information, either belief or experimental evidence, in
a data model to acquire more balanced results for a particular problem. For example, incorporating
prior information can mitigate the effect of a small sample size. Importantly, the use of the prior
evidence is achieved in a theoretically sound and principled way.
By using the knowledge of the entire posterior distribution of model parameters, Bayesian inference
is far more comprehensive and flexible than the traditional inference.
Bayesian inference is exact, in the sense that estimation and prediction are based on the posterior
distribution. The latter is either known analytically or can be estimated numerically with an arbitrary
precision. In contrast, many frequentist estimation procedures such as maximum likelihood rely on
the assumption of asymptotic normality for inference.

All of these sequences could have been generated in one line with generate and with the use of
the int and mod functions. The variables b through e are obtained with
. gen b = 1 + int((_n - 1)/2)
. gen c = 1 + mod(_n - 1, 6)
. gen d = 10 + mod(_n - 1, 3)
. gen e = 3 - mod(_n - 1, 3)
Nevertheless, seq() may save users from puzzling out such solutions or from typing in the needed
values.
In general, the sequences produced depend on the sort order of observations, following three rules:
1. observations excluded by if or in are not counted;
2. observations are sorted by varlist, if specified; and
3. otherwise, the order is that specified when seq() is called.
科学软件网不定期举办各类公益培训和讲座,让您有更多机会免费学习和熟悉软件。
http://turntech8843.b2b168.com


