使用期限租赁或*
许可形式单机和网络版
原产地美国
介质下载
适用平台window,mac,linux
科学软件网提供的软件覆盖各个学科,软件数量达1000余款,满足各高校和企事业单位的科研需求。此外,科学软件网还提供软件培训和研讨会服务,目前视频课程达68门,涵盖34款软件。
Stata 16 has a new suite of commands for performing meta-analysis. This suite lets you explore and combine the results from different studies. For instance, if you have collected results from 20 studies about the effect of a particular drug on blood pressure, you can summarize these studies and estimate the overall effect using meta-analysis.
The new meta suite is broad, but what sets it apart is its simplicity.
You can type, for instance,
. meta set effectsize stderr
to declare precomputed effect sizes or use meta esize to compute effects from summary data. With this, you can perform random-effects, fixed-effects, or common-effect meta-analysis.
To estimate an overall effect size and its confidence interval, obtain heterogeneity statistics, and more, you simply type
. meta summarize
And visualizing the results is as easy as typing
. meta forestplot
But the meta suite provides much more.
Meta-regression and subgroup analysis allow you to evaluate the heterogeneity of studies. These are available via meta regress and meta forestplot, subgroup() or meta summarize, subgroup().
You can investigate potential publication bias. Check visually for funnel-plot asymmetry using meta funnelplot; formally test for funnel-plot asymmetry using meta bias; and assess publication bias using the trim-and-fill method with meta trimfill.
You can even perform cumulative meta-analysis with meta summarize, cumulative().
All the meta-analysis features are documented in the new Meta-analysis Reference Manual.

Stata 16 于2019年6月26日**发布,更新了大量的新功能,详细信息请登陆科学软件网查看。
summarize displays the mean and standard deviation of a variable across observations; program
writers can access the mean in r(mean) and the standard deviation in r(sd) (see [R] summarize).
egen’s rowmean() function creates the means of observations across variables. rowmedian() creates
the medians of observations across variables. rowpctile() returns the #th percentile of the variables
specified in varlist. rowsd() creates the standard deviations of observations across variables.
rownonmiss() creates a count of the number of nonmissing observations, the denominator of the
rowmean() calculation
Stata 是一套提供其使用者数据分析、数据管理以及绘制图表的完整及整合性统计软件。它提供许许多多功能,包含线性混合模型、均衡重复反复及多项式普罗比模式。用Stata绘制的统计图形相当精美。
统计功能介绍
Stata使得大量的统计工具用于指尖
标准方法,如
基本表格和总结
案例对照分析
ARIMA
ANOVA 和MANOVA
线性回归
时间序列平滑
广义线性模型(GLM)
聚类分析
对比和比较
功率分析
样本选择
……
方法,如
多层模型
生存分析
动态面板数据回归
结构方程建模
二进制,计数和审查结果
ARCH
多重替代法
调查数据
Treatment effects
统计
贝叶斯分析
……
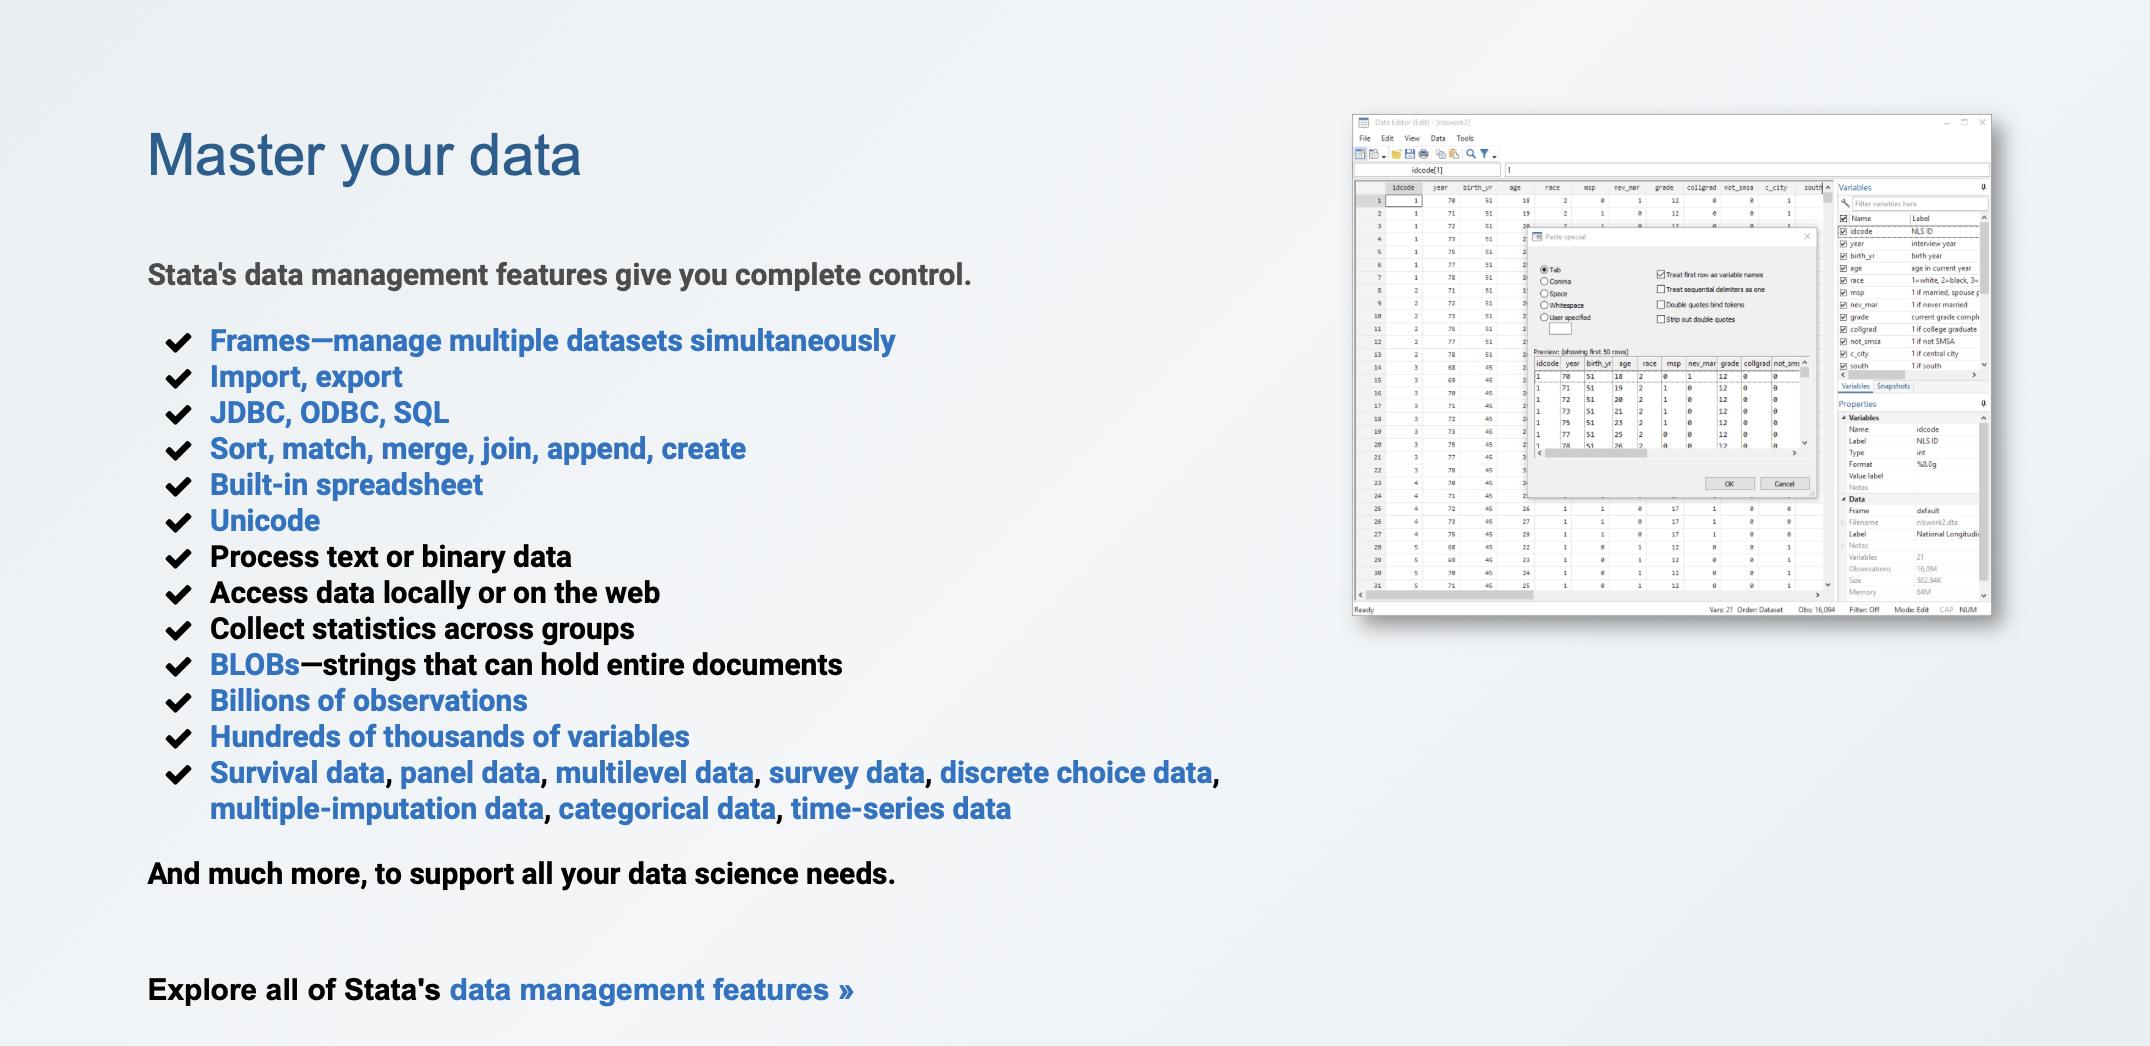
Stata的数据管理功能让您控制所有类型的数据。
您可以重组数据,管理变量,并收集各组并重复统计。您可以处理字节,整数,long, float,double和字符串变量(包括BLOB和达到20亿个字符的字符串)。Stata还有一些的工具用来管理的数据,如生存/时间数据、时间序列数据、面板/纵向数据、分类数据、多重替代数据和调查数据。
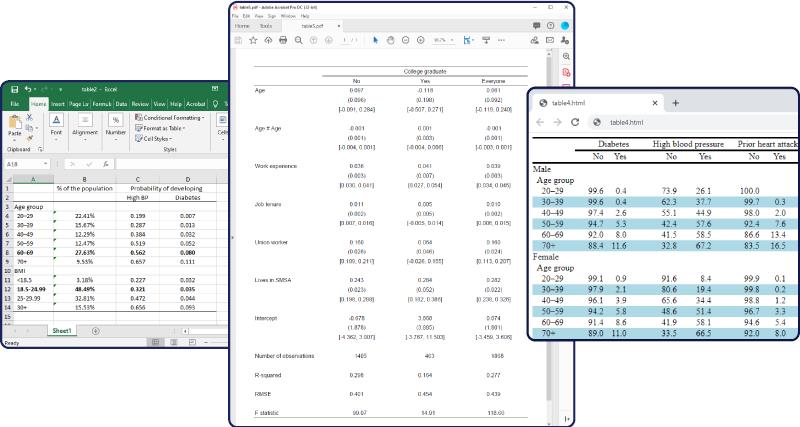
Stata轻松生成出版质量、风格迥异的图形。您可以编写脚本并以可复制的方式生成成百上千个图形,并且可以以EPS或TIF格式输出打印、以PNG格式或SVG格式输出放到网上、或PDF格式输出预览。使用这个图形编辑器可更改图形的任何方面,或添加标题、注释、横线、箭头和文本。
科学软件网主要提供以下科学软件服务:
1、软件培训服务:与国内大学合作,聘请业内人士定期组织软件培训,截止目前,已成功举办软件培训四十多期,累计学员2000余人,不仅让学员掌握了软件使用技巧,加深了软件在本职工作中的应用深度,而且也为**业人士搭建起了沟通的桥梁;
2、软件服务:提供软件试用版、演示版、教程、手册和参考资料的服务;
3、解决方案咨询服务:科学软件网可向用户有偿提供经济统计、系统优化、决策分析、生物制药等方面的解决方案咨询服务;
4、软件升级及技术支持服务:科学软件网可向用户提供软件的本地化技术支持服务,包括软件更新升级、软件故障排除、安装调试、培训等;
5、行业研讨服务:科学软件网会针对不**业,邀请国内外以及软件厂商技术人员,不定期在国内举办大型研讨会,时刻关注*技术,为国内行业技术发展提供导向。
http://turntech8843.b2b168.com


