使用期限租赁或*
许可形式单机和网络版
原产地美国
介质下载
适用平台window,mac,linux
科学软件网提供的软件覆盖各个学科,软件数量达1000余款,满足各高校和企事业单位的科研需求。此外,科学软件网还提供软件培训和研讨会服务,目前视频课程达68门,涵盖34款软件。
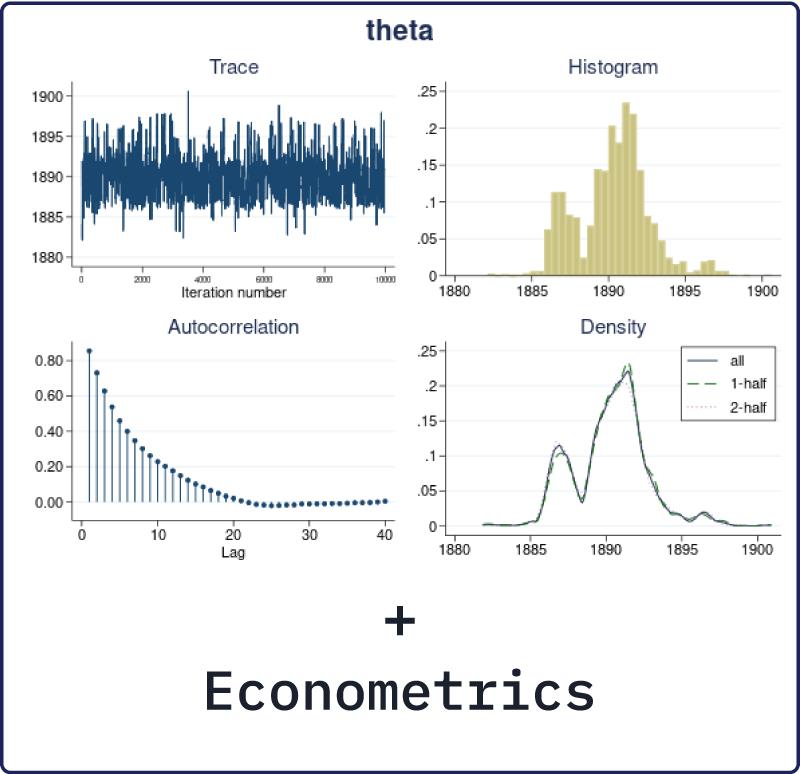
Advantages and disadvantages of Bayesian analysis
Bayesian analysis is a powerful analytical tool for statistical modeling, interpretation of results,
and prediction of data. It can be used when there are no standard frequentist methods available or
the existing frequentist methods fail. However, one should be aware of both the advantages and
disadvantages of Bayesian analysis before applying it to a specific problem.
The universality of the Bayesian approach is probably its main methodological advantage to the
traditional frequentist approach. Bayesian inference is based on a single rule of probability, the Bayes
rule, which is applied to all parametric models. This makes the Bayesian approach universal and
greatly facilitates its application and interpretation. The frequentist approach, however, relies on a
variety of estimation methods designed for specific statistical problems and models. Often, inferential
methods designed for one class of problems cannot be applied to another class of models.

Frequentist inference is based on the sampling distributions of estimators of parameters and provides
parameter point estimates and their standard errors as well as confidence intervals. The exact sampling
distributions are rarely known and are often approximated by a large-sample normal distribution.
Bayesian inference is based on the posterior distribution of the parameters and provides summaries of
this distribution including posterior means and their MCMC standard errors (MCSE) as well as credible
intervals. Although exact posterior distributions are known only in a number of cases, general posterior
distributions can be estimated via, for example, Markov chain Monte Carlo (MCMC) sampling without
any large-sample approximation.
Frequentist confidence intervals do not have straightforward probabilistic interpretations as do
Bayesian credible intervals. For example, the interpretation of a 95% confidence interval is that if
we repeat the same experiment many times and compute confidence intervals for each experiment,
then 95% of those intervals will contain the true value of the parameter. For any given confidence
interval, the probability that the true value is in that interval is either zero or one, and we do not
know which. We may only infer that any given confidence interval provides a plausible range for the
true value of the parameter. A 95% Bayesian credible interval, on the other hand, provides a range
for a parameter such that the probability that the parameter lies in that range is 95%.
Nonlinear DSGE models in Stata 15
In Stata 15, we introduced the dsge command for fitting linear DSGE models, which are time-series models used in economics and finance. These models are an alternative to traditional forecasting models. Both attempt to explain aggregate economic phenomena, but DSGE models do this on the basis of models derived from microeconomic theory.
New in Stata 16, the dsgenl command fits nonlinear DSGE models. Most DSGE models are nonlinear, and this means that you no longer need to linearize them by hand. When you enter equations into dsgenl, it linearizes them for you.
After estimating the parameters of your model with dsgenl, you can obtain the transition and policy matrices; determine the model’s steady state; estimate variables’ variances, covariances, and autocovariances implied by the system of equations; and create and graph impulse–response functions.
This is likely to be the favorite feature of macroeconomists and anyone working in a central bank.
Stata的数据管理功能让您控制所有类型的数据。
您可以重组数据,管理变量,并收集各组并重复统计。您可以处理字节,整数,long, float,double和字符串变量(包括BLOB和达到20亿个字符的字符串)。Stata还有一些的工具用来管理的数据,如生存/时间数据、时间序列数据、面板/纵向数据、分类数据、多重替代数据和调查数据。
Stata轻松生成出版质量、风格迥异的图形。您可以编写脚本并以可复制的方式生成成百上千个图形,并且可以以EPS或TIF格式输出打印、以PNG格式或SVG格式输出放到网上、或PDF格式输出预览。使用这个图形编辑器可更改图形的任何方面,或添加标题、注释、横线、箭头和文本。
真正的文档
当Stata执行您的分析或理解使用的方法时,Stata不会让您孤立无援或订购很多书籍来了解每个细节。
我们每一个数据管理功能都有完整的解释,并记录在案,并在实践中显示实际的例子。每一个估计都有完全记录,包含几个真实数据的例子,真正讨论如何解释结果。这些例子都给了数据,您可以直接在Stata中使用,甚至扩展您的分析。我们给您快速启动每一个功能,展示一些常用用途。想要了解更多细节,我们的方法和公式部分提供了计算的细节,我们参考部分会给出更多信息。
Stata是一个很大的软件包,包含了非常多的文档,**过27卷14,000页的内容。不用担心,在Help菜单中输入要搜索的内容,Stata会搜索到关键词、指数,甚至用户编写的程序包,这些会让您得到想要了解的一切。Stata包含了所有这些您想要的内容。
使用Mata进行矩阵编程
Mata是一个成熟的编程语言,可编译您所输入的任何字节,并进行优化和准确执行。
尽管您不需要使用Stata进行编程,但是它作为一个快速完成矩阵的编程语言,是Stata功能中不可或缺的一部分。Mata既是一个操作矩阵的互动环境,也是一个完整开发环境,可以生产编译和优化代码。它还包含了一些功能来处理面板数据、执行真实或复制的矩阵运算,提供完整的支持面向对象的编程,并完全兼容Stata。
科学软件网专注提供正版软件,跟上百家软件开发商有紧密合作,价格优惠,的和培训服务。
http://turntech8843.b2b168.com