使用期限租赁或*
许可形式单机和网络版
原产地美国
介质下载
适用平台window,mac,linux
科学软件网提供的软件上千款,涉及所有学科领域,您所需的软件,我们都能提供。科学软件网提供的软件涵盖领域包括经管,仿真,地球地理,生物化学,工程科学,排版及网络管理等。同时,还提供培训、课程(包含34款软件,66门课程)、实验室解决方案和项目咨询等服务。
This manual is protected by copyright. All rights are reserved. No part of this manual may be reproduced, stored
in a retrieval system, or transcribed, in any form or by any means—electronic, mechanical, photocopy, recording, or
otherwise—without the prior written permission of StataCorp LP unless permitted subject to the terms and conditions
of a license granted to you by StataCorp LP to use the software and documentation. No license, express or implied,
by estoppel or otherwise, to any intellectual property rights is granted by this document.
What is Bayesian analysis?
Bayesian analysis is a statistical analysis that answers research questions about unknown parameters
of statistical models by using probability statements. Bayesian analysis rests on the assumption that
all model parameters are random quantities and thus are subjects to prior knowledge. This assumption
is in sharp contrast with the more traditional, also called frequentist, statistical inference where all
parameters are considered unknown but fixed quantities. Bayesian analysis follows a simple rule
of probability, the Bayes rule, which provides a formalism for combining prior information with
evidence from the data at hand. The Bayes rule is used to form the so called posterior distribution of
model parameters. The posterior distribution results from updating the prior knowledge about model
parameters with evidence from the observed data. Bayesian analysis uses the posterior distribution to
form various summaries for the model parameters including point estimates such as posterior means,
medians, percentiles, and interval estimates such as credible intervals. Moreover, all statistical tests
about model parameters can be expressed as probability statements based on the estimated posterior
distribution.
generate’s sum() function creates the vertical, running sum of its argument, whereas egen’s
total() function creates a constant equal to the overall sum. egen’s rowtotal() function, however,
creates the horizontal sum of its arguments. They all treat missing as zero. However, if the missing
option is specified with total() or rowtotal(), then newvar will contain missing values if all
values of exp or varlist are missing.
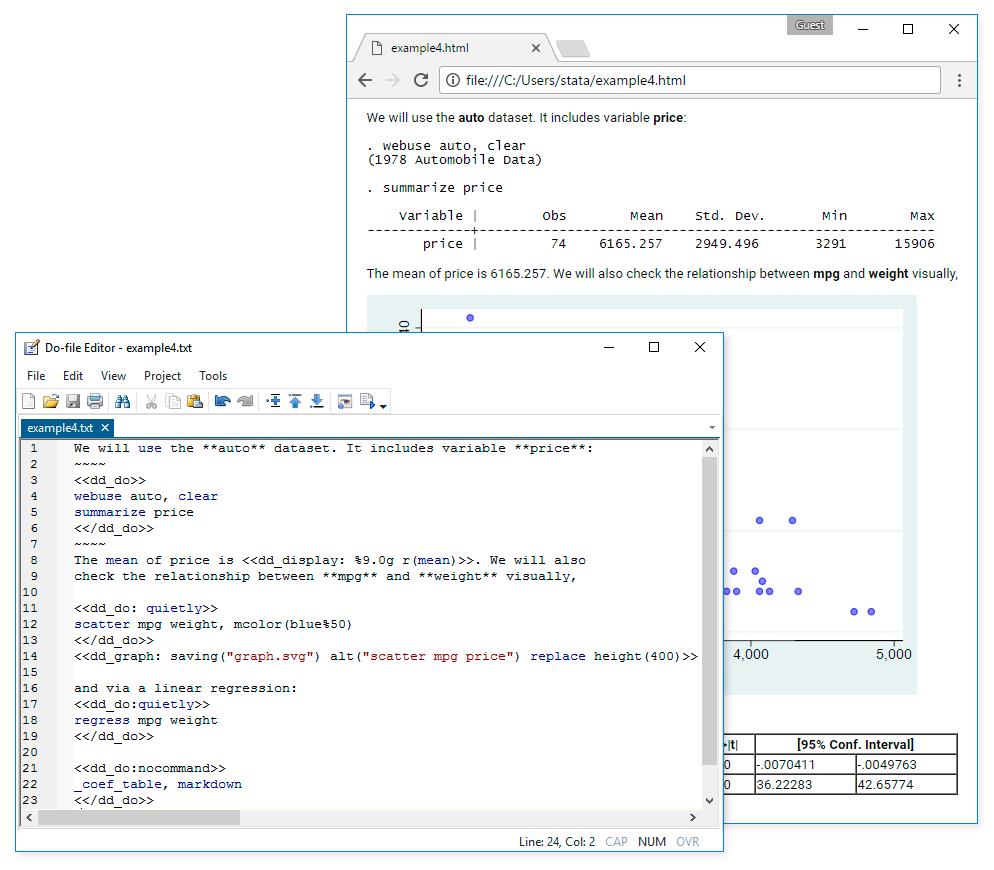
Stata’s reporting features allow you to create Word, PDF, Excel, and HTML documents that incorporate Stata results and graphs with formatted text and tables. Regardless of the type of document you create, you can rely on Stata’s integrated versioning features to ensure that your reports are reproducible.
Want dynamic reports that are updated as your data change? Stata’s reporting features make this easy too. Rerun the command or do-file that created your report with the updated dataset, and all Stata results in the report are updated automatically.
Stata 16 has new and improved reporting features, of course, but as importantly, all of Stata's reporting features are now documented in a new Reporting Reference Manual. The manual includes many new examples that demonstrate workflows and provide guidance on customizing the Word, PDF, Excel, and HTML documents you create using Stata.
19年来,公司始终秉承、专注、专心的发展理念,厚积薄发,积累了大量的人才、技术以及行业经验,在行业内得到了大量用户的认可和高度价。
http://turntech8843.b2b168.com


