使用期限*
许可形式单机
原产地美国
介质下载
适用平台windows
科学软件网专注提供科研软件。截止目前,共代理千余款,软件涵盖各个学科。除了软件,科学软件网还提供课程,包含34款软件,66门课程。热门软件有:spss,stata,gams,sas,minitab,matlab,mathematica,lingo,hydrus,gms,pscad,mplus,tableau,eviews,nvivo,gtap,sequncher,simca等等。
Example Files
A variety of files are included with Grapher. You can run the
as is or you can customize the .
To run a sample in Grapher'sScript Manager:
1. Open Grapher.
2. Check the View | Display | Managercommand. A check mark
will indicate the manager is displayed.
3. In the Manager, click the button.
4. In the Open dialog, select a sample .BAS file and click Open. The
sample scripts folder is located at C:\Program Files\Golden
Software\Grapher 13\Samples\Scripts by default. The is
displayed in the Manager.
5. Click the button to execute the .

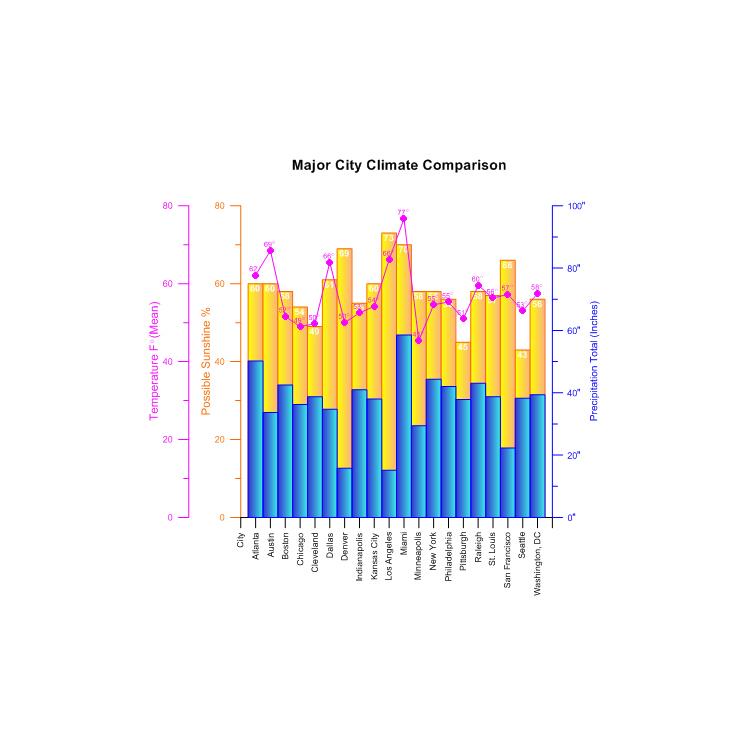
Create Professional Graphs
Quickly create stunning and informative 2D and 3D graphs. Choose from over 80 different graph types and communicate your message to any audience with Grapher's extensive graphing abilities. Click on the below graph groupings to see the different plots Grapher creates.

Worksheet Manager
The Worksheet Manager contains a view of all data loaded into
Grapher. Multiple data files are displayed in a tabbed format. By default,
the Worksheet Managerappears at the right of theGrapherwindow.
Right-click inside the Worksheet Manager to open the worksheet menu
commands. These commands are named similarly to the commands on the
ribbon. Use the Home | New Graph commands to create a graph in the
current plot window. Use the Data Toolsmenu commands to transform,
sort, or generate statistics for the worksheet data.

Plot Types
Several unique 2D and 3D plot types can be created, modified, and
displayed with Grapher. The Home tab New Graph commands or the
graph wizard are used to create a graph. The plot types are organized in
the Home | New Graph groupby category:
Basic Plots
Basic plots include 2D line plots,
scatter plots, line/scatter plots, step
plots, function plots, bubble plots,
and class plots. In most cases, two
variables are displayed on two axes.
The Basic plots also include 3D
ribbon plots, 3D wall plots, 3D step
plots, and 3D function plots. In
these cases, two variables are
displayed with a 3D view. Basic
plots also include XYZ line/scatter
plot, bubble plots, and class plots.
These are true three-dimensional
plots, using at least three variables
and three axes.
科学软件网的客户涵盖产品涵盖教育、、交通、通信、金融、保险、电力等行业,并且为诸如北京大学、*大学、中国大学、中科院、农科院、社科院、环科院、国家、交通部、南方电网、国家电网、许继、南瑞等国内大型企事业单位、部委和科研机构长期提供相关产品。我们的品质,值得您信赖。
http://turntech8843.b2b168.com