使用期限*
许可形式单机
原产地美国
介质下载
适用平台windows
科学软件网专注提供科研软件。截止目前,共代理千余款,软件涵盖各个学科。除了软件,科学软件网还提供课程,包含34款软件,66门课程。热门软件有:spss,stata,gams,sas,minitab,matlab,mathematica,lingo,hydrus,gms,pscad,mplus,tableau,eviews,nvivo,gtap,sequncher,simca等等。
Work Smart, Not Hard with Automation
Don’t waste time doing the same process over and over. Create scripts to automate repetitive tasks, and run your favorite scripts directly from the Grapher ribbon. Grapher can be called from any automation-compatible programming languages such as C++, Python, or Perl. Grapher also ships with Scripter, a built-in Visual Basic compatible scripting tool. Better yet, use the recorder to transform actions performed in Grapher into a .

Grapher是一个功能全面的科学绘图软件包,允许用户以多种格式导入数据,创建和组合多种二维和三维图形类型,并以非常详细的方式定制这些图形。
数据可视化
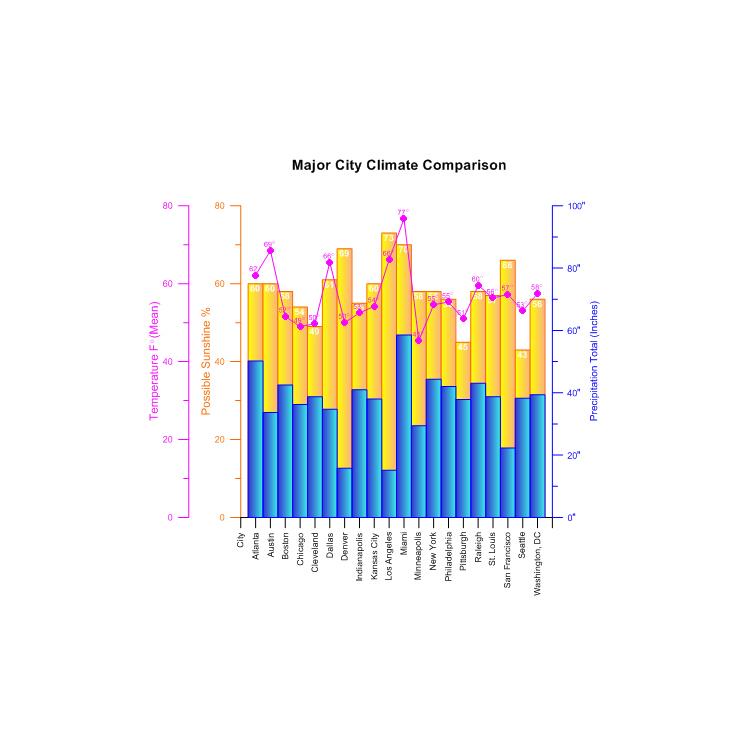
好的呈现您的数据。Grapher提供70多种2D和3D绘图选项来大限度的显示数据。
分析数据
不会**数据可能隐藏的有价值信息。使用Grapher广泛的分析图表、工具和统计功能来识别趋势,找到新的见解和定位机会。Grapher提供对数据的整体视图。
结果说明
Grapher提供广泛的图形类型选项和无数的定制选项,让您以非常*理解的格式表达您复杂的想法。让您的数据跟Grapher说话。
值得信任的解决方案
Grapher受到**数以千计的科学家、和商业的信任。他们信任Grapher并用它展示数据。
功能
创建的图表
快速创建令人惊叹的信息丰富的2D和3D图形。有**过70个不同的图表类型并使用Grapher已有的图表功能来展现您的数据。

Worksheet Window
The worksheet window contains commands to display, edit, enter, and
save data. The worksheet window has several useful and powerful editing,
transformation, and statistical operations available. Several import and
export options are available for opening data files from other spreadsheet
programs. The Data Tools tab is automatically selected when you open or
switch to a worksheet document.
To enter data in a worksheet, use the File | Open command to open an
existing data file or click the File | New | Worksheet command to create a
blank worksheet. Data already used to create plots can be opened in the
worksheet window with the Graph Tools | Worksheet | Display command.

Grapher是一个功能全面的科学绘图软件包,允许用户以多种格式导入数据,创建和组合多种二维和三维图形类型,并以非常详细的方式定制这些图形。
数据可视化
好的呈现您的数据。Grapher提供70多种2D和3D绘图选项来大限度的显示数据。
分析数据
不会**数据可能隐藏的有价值信息。使用Grapher广泛的分析图表、工具和统计功能来识别趋势,找到新的见解和定位机会。Grapher提供对数据的整体视图。
轻松自动化工作
不用浪费时间重复一样的工作。创建脚本来自动执行重复性任务,并直接从Grapher任务栏中运行您喜欢的脚本。可以从任何自动化兼容的编程语言中调用Grapher,如C++,Python或Perl。Grapher可以运送脚本编写者,一个内置的Visual Basic兼容的脚本工具。更好的是,使用脚本记录器对Grapher中的脚本进行操作转换。
系统要求
Windows 7, 8 (excluding RT), 10 or higher
32-bit and 64-bit operation system support
1024 x 768 or higher monitor resolution with minimum 16-bit color depth
At least 500 MB free hard disk space
At least 512 MB RAM
科学软件网不仅提供软件产品,更有多项附加服务免费提供,让您售后**!
http://turntech8843.b2b168.com


