使用期限*
许可形式单机
原产地美国
介质下载
适用平台windows
科学软件网销售软件达19年,有丰富的销售经验以及客户资源,提供的产品涵盖各个学科,包括经管,仿真,地球地理,生物化学,工程科学,排版及网络管理等。此外,我们还提供很多附加服务,如:现场培训、课程、解决方案、咨询服务等。
Scripter
The Scripter program, included with Grapher, is useful in creating, editing,
and running files that automate Grapher procedures. By writing and
running files, simple mundane tasks or complex system integration
tasks can be performed precisely and repetitively without direct
interaction. Grapher also supports ActiveX Automation using any
compatible client, such as Visual BASIC. The automation capabilities allow
Grapher to be used as a data visualization and graph generation postprocessor for any scientific modeling system.

Analyze Data
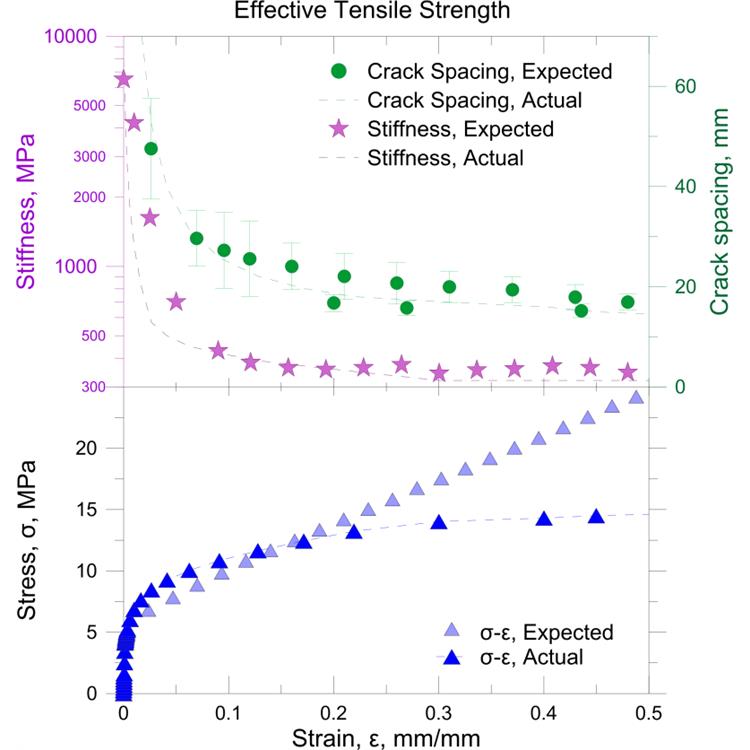
Don’t miss any opportunity. Your data may be hiding valuable information. Utilize Grapher’s extensive analysis charts, tools, and statistical features to identify trends, find new insights, and locate opportunities. Grapher provides a holistic view of your data.

Achieve Deeper Insights
Make informed decisions with Grapher. Discover new opportunities and trends hiding in your data with Grapher’s statistical tools. Add custom or pre-defined fit curves, error bars, or compute statistics on the raw data for a thorough understanding of the underlying trend.
Grapher Statistical Tools
Insert custom or pre-defined fit curves
Apply confidence intervals
Include error bars
Perform statistical calculations on the raw data
Display statistical reports

分析数据
不会**数据可能隐藏的有价值信息。使用Grapher广泛的分析图表、工具和统计功能来识别趋势,找到新的见解和定位机会。Grapher提供对数据的整体视图。
,专注,专心是科学软件网的服务宗旨,开发的软件、传递*的技术、提供贴心的服务是我们用实际行动践行的**目标,我们会为此目标而不懈努力。
http://turntech8843.b2b168.com


