使用期限*
许可形式单机
原产地美国
介质下载
适用平台windows
科学软件网专注提供科研软件。截止目前,共代理千余款,软件涵盖各个学科。除了软件,科学软件网还提供课程,包含34款软件,66门课程。热门软件有:spss,stata,gams,sas,minitab,matlab,mathematica,lingo,hydrus,gms,pscad,mplus,tableau,eviews,nvivo,gtap,sequncher,simca等等。
Grapher定制选项
添加图例、标题和坐标轴
包括插入缩放或图形放大镜
编辑所有轴参数,多轴
格式轴刻度为线性、对数、自然对数、概率或日期/时间
整合多个图形
添加拟合曲线、错误条和统计报表
将每个图形组件放置在的位置
定义自定义行样式、颜色和填充
编辑文本、行、填充和符号属性
添加文本、折线、多边形、符号和样条线
更多…….

Sections with multiple properties appear with a plus or minus to the
left of the name. To expand a section, click on the button. To collapse a
section, click on the icon. For example, the expanded End Styles section
contains three properties: Start, End, and Scale.
The Property Manager displays the properties for selected objects. To
change a property, click on the property's value and type a new value,
scroll to a new number using the buttons, select a new value using the
slider, or select a new value from the list or palette. For
example, a polyline has Style, Color, Opacity, and Width propertiesand an
End Styles sub-section with Start, End, and Scale properties. Changing the
Color requires clicking on the current color and selecting a new color from
the color palette. Changing the Opacity requires typing a new value or
clicking on the slider bar and dragging it left or right to a new value.
Changing the Width requires typing a new number or scrolling to a new
number. Changing the End requires clicking on the existing style and
clicking on a new style in the list.
The selections in the Property Manager control which properties are
displayed. Properties are hidden when they do not have an effect on the
object. For example when the Gradient is set to None on the Fill page, the
Colormap and Fill orientation properties are hidden. When the Gradient is
changed to Linear, the Colormap and Fill orientation properties are
displayed, while the Pattern, Foreground color, and Foreground opacity
properties are hidden.
You can modify more than one object at a time. For example, click on X
Axis 1 in the Object Manager, and then hold the CTRL key and click Y
Axis 1. You can change the properties of each axis simultaneously in the
Property Manager. Only shared properties may be edited when multiple
objects are selected. For example, only the line properties are displayed
when both a polyline and polygon are selected. You can edit multiple plots
of the same type at one time. However, no properties are displayed when
the selected plots are different plot types.

结果说明
Grapher提供广泛的图形类型选项和无数的定制选项,让您以非常*理解的格式表达您复杂的想法。让您的数据跟Grapher说话。
值得信任的解决方案
Grapher受到**数以千计的科学家、和商业的信任。他们信任Grapher并用它展示数据。
功能
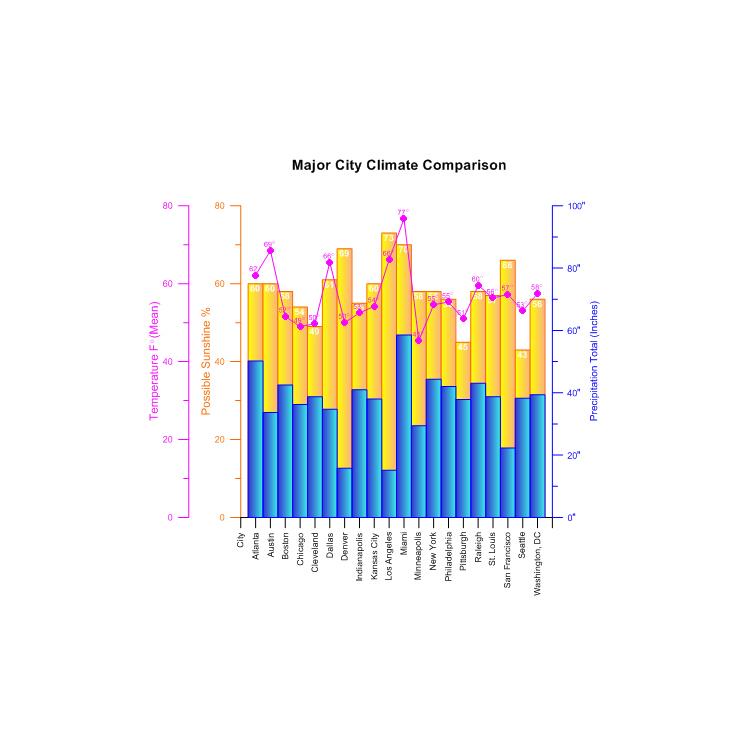
创建的图表
快速创建令人惊叹的信息丰富的2D和3D图形。有**过70个不同的图表类型并使用Grapher已有的图表功能来展现您的数据。
Create one of more than 60 unique graph types. Create 2D or 3D linear or logarithmic line, scatter, function, class scatter, bubble, bar charts, and floating bar chart graphs. Create line , bar, rose, wind, and radar polar plots. Create 2D and 3D vector plots. Create line, scatter, or bubble ternary diagrams. Display high-low-close or candlestick specialty plots. Create statistical graphs including histograms, box-whisker, pie charts, and Q-Q plots.
科学软件网主要提供以下科学软件服务:
1、软件培训服务:与国内大学合作,聘请业内人士定期组织软件培训,截止目前,已成功举办软件培训四十多期,累计学员2000余人,不仅让学员掌握了软件使用技巧,加深了软件在本职工作中的应用深度,而且也为**业人士搭建起了沟通的桥梁;
2、软件服务:提供软件试用版、演示版、教程、手册和参考资料的服务;
3、解决方案咨询服务:科学软件网可向用户有偿提供经济统计、系统优化、决策分析、生物制药等方面的解决方案咨询服务;
4、软件升级及技术支持服务:科学软件网可向用户提供软件的本地化技术支持服务,包括软件更新升级、软件故障排除、安装调试、培训等;
5、行业研讨服务:科学软件网会针对不**业,邀请国内外以及软件厂商技术人员,不定期在国内举办大型研讨会,时刻关注*技术,为国内行业技术发展提供导向。
http://turntech8843.b2b168.com