使用期限租赁或*
许可形式单机和网络版
原产地美国
介质下载
适用平台window,mac,linux
科学软件网专注提供科研软件。截止目前,共代理千余款,软件涵盖各个学科。除了软件,科学软件网还提供课程,包含34款软件,66门课程。热门软件有:spss,stata,gams,sas,minitab,matlab,mathematica,lingo,hydrus,gms,pscad,mplus,tableau,eviews,nvivo,gtap,sequncher,simca等等。
The fill() and seq() functions are alternatives. In essence, fill() requires a minimal example
that indicates the kind of sequence required, whereas seq() requires that the rule be specified through
options. There are sequences that fill() can produce that seq() cannot, and vice versa. fill()
cannot be combined with if or in, in contrast to seq(), which can.
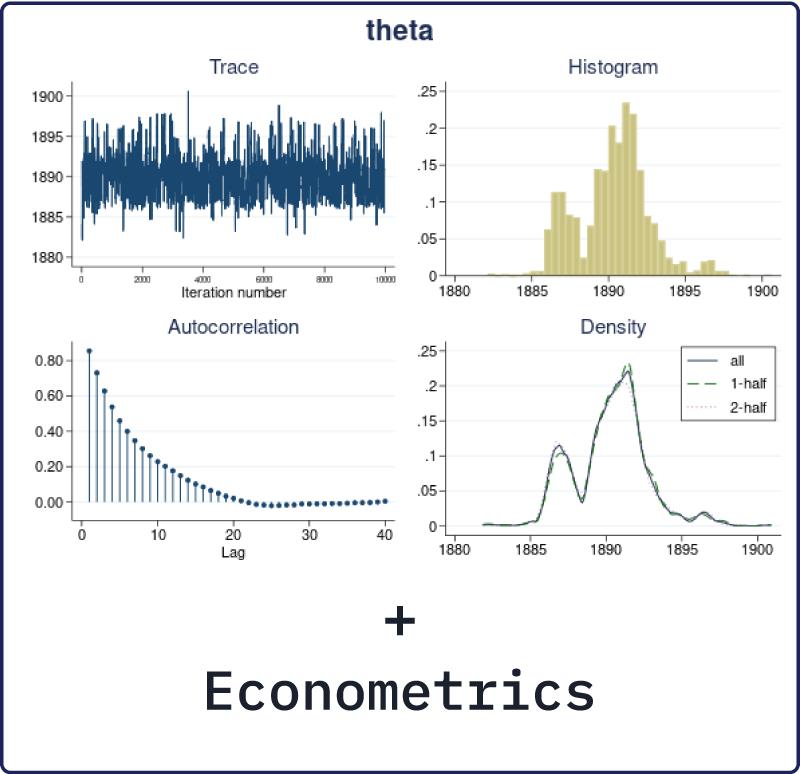
Bayesian and frequentist approaches have very different philosophies about what is considered fixed
and, therefore, have very different interpretations of the results. The Bayesian approach assumes that
the observed data sample is fixed and that model parameters are random. The posterior distribution
of parameters is estimated based on the observed data and the prior distribution of parameters and is
used for inference. The frequentist approach assumes that the observed data are a repeatable random
sample and that parameters are unknown but fixed and constant across the repeated samples. The
inference is based on the sampling distribution of the data or of the data characteristics (statistics). In
other words, Bayesian analysis answers questions based on the distribution of parameters conditional
on the observed sample, whereas frequentist analysis answers questions based on the distribution of
statistics obtained from repeated hypothetical samples, which would be generated by the same process
that produced the observed sample given that parameters are unknown but fixed. Frequentist analysis
consequently requires that the process that generated the observed data is repeatable. This assumption
may not always be feasible. For example, in meta-analysis, where the observed sample represents the
collected studies of interest, one may argue that the collection of studies is a one-time experiment.
主讲嘉宾
刘**,南开大学博士,曾赴爱尔兰格里菲斯学院交流学习,曾任河北金融学院教师,主讲计量经济学、统计学、与金融统计等课程。曾在《亚太经济》,《财经科学》,《农业技术经济》,《经济问题探索》等刊物发表多篇论文,并著有《中国金融发展的收入分配效应》。
Stata是一款完整的、集成的统计软件包,提供您需要的一切数据分析、数据管理和图形。
快速,简单并易于使用
点击式的界面和强大,直观的命令语言让Stata使用起来快速,并易于使用。
所有的分析结果都可以被复制和存档,并用来出版和审查。不管您什么时候写的内容,版本控制系统确保统计程序可继续生成同样的结果。
统计功能介绍
Stata使得大量的统计工具用于指尖
标准方法,如
基本表格和总结
案例对照分析
ARIMA
ANOVA 和MANOVA
线性回归
时间序列平滑
广义线性模型(GLM)
聚类分析
对比和比较
功率分析
样本选择
……
方法,如
当Stata执行您的分析或理解使用的方法时,Stata不会让您孤立无援或订购很多书籍来了解每个细节。
我们每一个数据管理功能都有完整的解释,并记录在案,并在实践中显示实际的例子。每一个估计都有完全记录,包含几个真实数据的例子,真正讨论如何解释结果。这些例子都给了数据,您可以直接在Stata中使用,甚至扩展您的分析。我们给您快速启动每一个功能,展示一些常用用途。想要了解更多细节,我们的方法和公式部分提供了计算的细节,我们参考部分会给出更多信息。
Stata是一个很大的软件包,包含了非常多的文档,**过27卷14,000页的内容。不用担心,在Help菜单中输入要搜索的内容,Stata会搜索到关键词、指数,甚至用户编写的程序包,这些会让您得到想要了解的一切。Stata包含了所有这些您想要的内容。
19年来,公司始终秉承、专注、专心的发展理念,厚积薄发,积累了大量的人才、技术以及行业经验,在行业内得到了大量用户的认可和高度价。
http://turntech8843.b2b168.com


