使用期限*
许可形式单机
原产地美国
介质下载
适用平台windows
科学软件网提供软件和培训服务已有19年,拥有丰富的经验,提供软件产品上千款,涵盖领域包括经管,仿真,地球地理,生物化学,工程科学,排版及网络管理等。同时还有的服务,现场培训+课程,以及本地化服务。
With Grapher, creating a graph is as easy as choosing the graph type,
selecting the data file, and clicking the Open button. Grapher
automatically selects reasonable default settings for each new graph,
though all of the graph settings can be modified. For example, you can
change tick mark spacing, tick labels, axis labels, axis length, grid lines,
line colors, symbol styles, and more. You can add legends, images, fit
curves, and drawing objects to the graph. To apply the same custom
settings to several graphs, you can create a Grapher template containing
the preferred styles. Automate data processing and graph creation using
Golden Software's Scripter program or any Active X automation program.
Once the graph is complete, you can export it in a variety of formats for
use in presentations and publications.

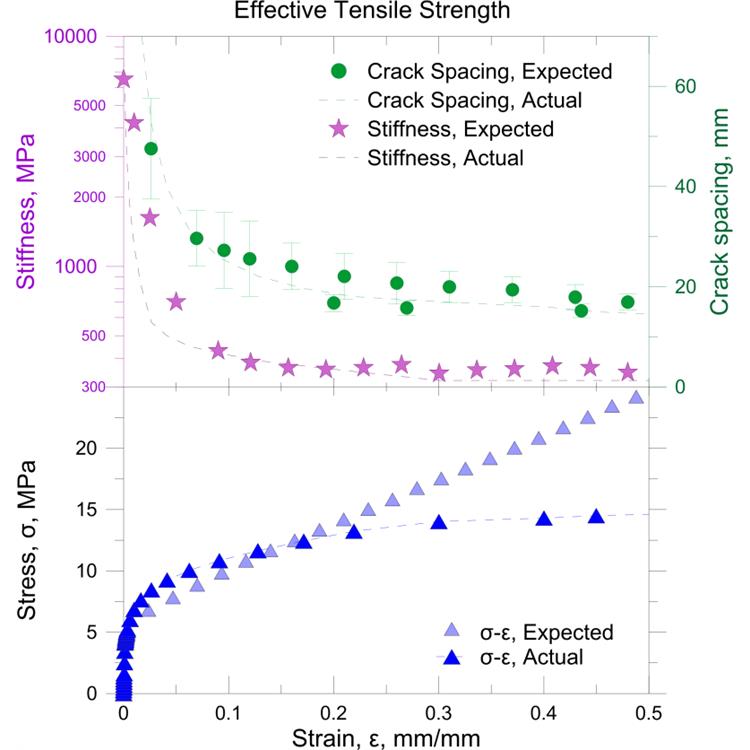
好的展现数据
把您图形的每个方面都控制在小的细节上。Grapher广泛的定制选项让您以易于理解的方式传达复杂的想法。Grapher以佳的方式展现数据。
Grapher定制选项
添加图例、标题和坐标轴
包括插入缩放或图形放大镜
编辑所有轴参数,多轴
格式轴刻度为线性、对数、自然对数、概率或日期/时间
整合多个图形
添加拟合曲线、错误条和统计报表
将每个图形组件放置在的位置
定义自定义行样式、颜色和填充
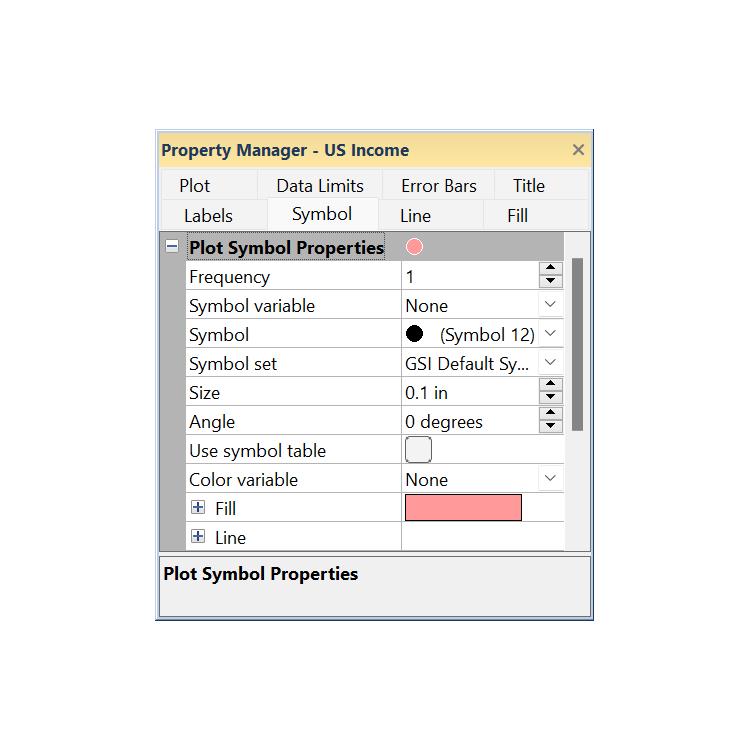
编辑文本、行、填充和符号属性
添加文本、折线、多边形、符号和样条线
更多…….
Create clear, concise graphs quickly and easily.
Customize every portion of every graph to make the graph completely unique to your situation!
Easily create custom graphs using the easy to follow Graph Wizard.
Add legends, curve fits, annotations, and drawing objects to complete the graph.
Communicate your graph to the entire world with full international fonts and character support. Display text such as Chinese, Russian, Greek, Hebrew, or Arabic.

Grapher is a fixed part of my life these days - for work, research, and personal matters. I recommend it to anyone who will listen!

The graph is created with the specified properties. You can change the
properties of a selected graph, plot, or axis through the Property Manager.
Creating Graphs in the Plot Window
The most common method of creating graphs is to use the Home | New
Graph commands. To create a graph in the plot window:
1. Click or scroll to the Home tab.
2. In the New Graph group, click the Basic, Bar, Polar, Ternary,
Specialty, Statistical, or Contour Surface plot category.
3. Click on the plot type you would like to create.
4. Select a data file in the Open Worksheet dialog and click Open. If you
are creating a contour grid map or surface grid map, you are prompted
for a .GRD file. If you are creating
19年来,公司始终秉承、专注、专心的发展理念,厚积薄发,积累了大量的人才、技术以及行业经验,在行业内得到了大量用户的认可和高度价。
http://turntech8843.b2b168.com