使用期限*
许可形式单机
原产地美国
介质下载
适用平台windows
科学软件网销售软件达19年,有丰富的销售经验以及客户资源,提供的产品涵盖各个学科,包括经管,仿真,地球地理,生物化学,工程科学,排版及网络管理等。此外,我们还提供很多附加服务,如:现场培训、课程、解决方案、咨询服务等。
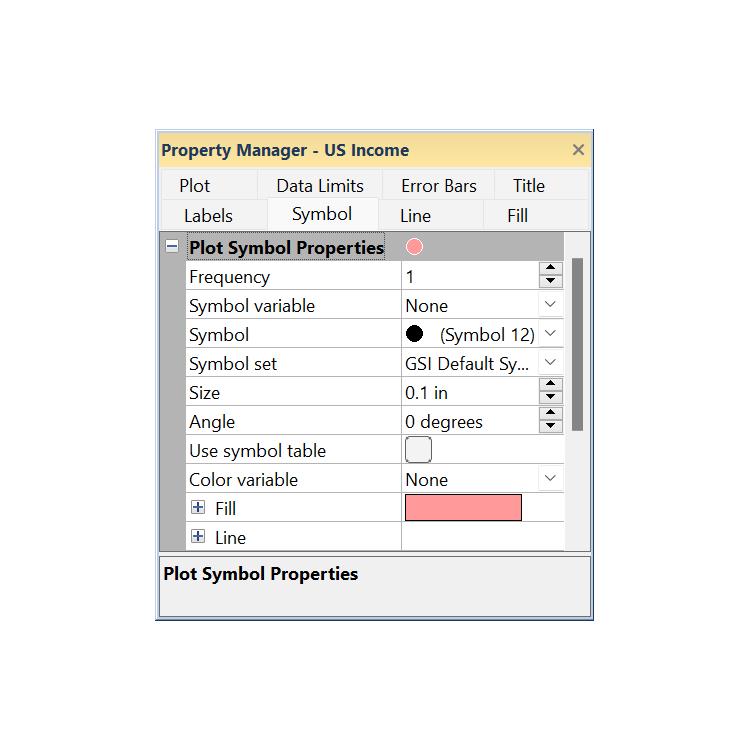
Grapher .GRT Template Files
Grapher .GRT files are used to create a template with set graphing
preferences. A saved template file does not contain a reference to a
specific data file. This means that once the template graph is created, you
can use the template with any data set. You can use the template to set
options such as the number of decimal places on axis tick mark labels,
label angles, axis labels, graph titles, line plot colors, fill colors, symbol
size, or any other graphing option. If a .GRT file is sent to a colleague,
they can use their own data set with the file to create a graph based on
the specifications in the template file. This format is preferred when the
layout of the graph needs to remain consistent with a variety of similarly
formatted data files.
Data Files
In most cases, there is a prompt for a data file when you create a graph in
Grapher. Data files can be imported from a variety of sources, such as
ASCII text files, Excel files, or database files. Data can be entered directly
into Grapher’s worksheet if the files do not already exist. The data needs
to be in column and row format. Data files can also be created, edited, and
saved in Grapher's worksheet. Some of the most commonly used data
types are described in the following sections.

Achieve Deeper Insights
Make informed decisions with Grapher. Discover new opportunities and trends hiding in your data with Grapher’s statistical tools. Add custom or pre-defined fit curves, error bars, or compute statistics on the raw data for a thorough understanding of the underlying trend.
Grapher Statistical Tools
Insert custom or pre-defined fit curves
Apply confidence intervals
Include error bars
Perform statistical calculations on the raw data
Display statistical reports

Grapher User Interface
Grapher contains four document window types: the plot window,
worksheet window, grid window, and Excel worksheet window. Graphs and
maps are displayed and edited in the plot window. Tabular data files are
displayed, edited, transformed, and saved in the worksheet window. A
native Excel workbook can be opened in the Excel window. Grid files can
be viewed in the grid window. The Grapher user interface consists of the
quick access toolbar, ribbon tabs and commands, tabbed documents,
managers, and a status bar.

完全兼容
无缝地可视化和分析来自多个数据源的数据。Grapher可以读取多种文件格式,包括ACCDB、DBF和XLSL。Grapher还支持多种流行的输出格式。轻松管理Grapher中的数据。
科学软件网主要提供以下科学软件服务:
1、软件培训服务:与国内大学合作,聘请业内人士定期组织软件培训,截止目前,已成功举办软件培训四十多期,累计学员2000余人,不仅让学员掌握了软件使用技巧,加深了软件在本职工作中的应用深度,而且也为**业人士搭建起了沟通的桥梁;
2、软件服务:提供软件试用版、演示版、教程、手册和参考资料的服务;
3、解决方案咨询服务:科学软件网可向用户有偿提供经济统计、系统优化、决策分析、生物制药等方面的解决方案咨询服务;
4、软件升级及技术支持服务:科学软件网可向用户提供软件的本地化技术支持服务,包括软件更新升级、软件故障排除、安装调试、培训等;
5、行业研讨服务:科学软件网会针对不**业,邀请国内外以及软件厂商技术人员,不定期在国内举办大型研讨会,时刻关注*技术,为国内行业技术发展提供导向。
http://turntech8843.b2b168.com