使用期限*
许可形式单机和网络版
原产地美国
介质下载
适用平台windows
科学软件网提供的软件覆盖各个学科,软件数量达1000余款,满足各高校和企事业单位的科研需求。此外,科学软件网还提供软件培训和研讨会服务,目前视频课程达68门,涵盖34款软件。
在地质统计学之前总结您的数据
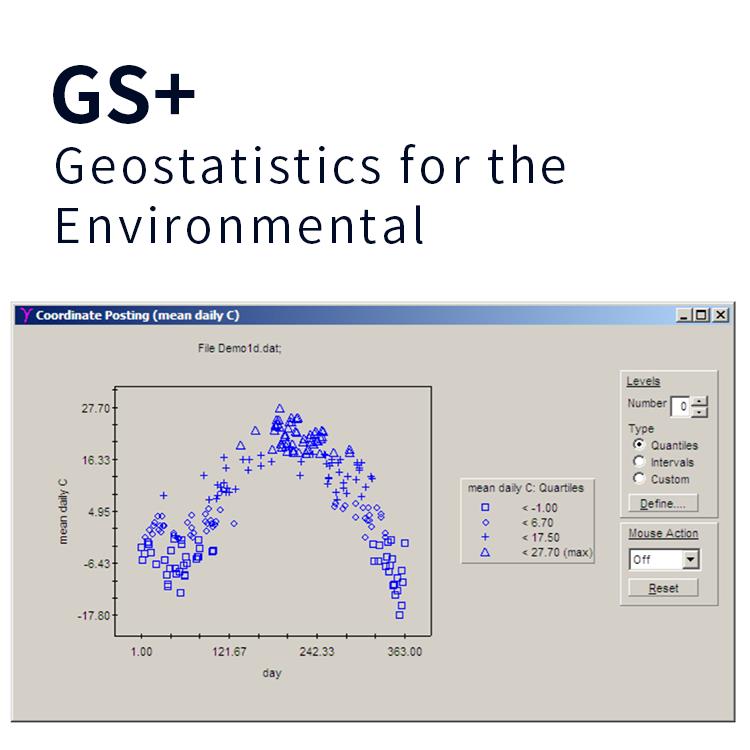
GS+还提供基本的参数统计,使您能够在地质统计学分析之前对数据进行描述。当一个数据集准备进行分析时,GS+报告统计数据,例如平均值、范围、标准差、峰度和偏度,也会创建频率和概率分布,这样您就可以评估偏离正常的情况。分位数散射图提供了样本位置的可视映射,并确定具有特定值的数据的位置。
0
满足各种需求的插值方法
GS+提供了三种不同类型的插值。普通的kriging(包括块和准时性)提供了一个跨空间域属性的优估计。条件模拟还提供优估计,但在其位置上的原始数据可以用于映射域中的尖锐边界。基于简单的近邻计算,逆距离加权可能是好的非地质统计插值技术。GS+还提供cokriging,当您的主要数据由许多额外位置收集的数据支持时,这可能是有用的。Cokriging可用于块和准时kriging,并可用于有条件的模拟。协同定位cokriging可用于条件模拟。多边形掩码允许您在映射的域中包含或排除复杂的形状。跨越岛屿或避免在停车场内插补--还可以嵌套多边形并重叠它们。
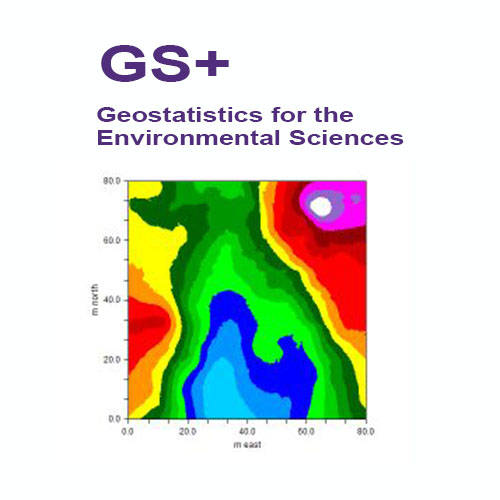
创建可由许多其他程序使用的内插输出文件
GS+创建插值输出文件(从kriging、cokriging、模拟或逆距离技术),可以读取到许多其他类型的映射程序。GS+将使用这些文件来创建它自己的地图,或者您可以将数据读入支持ARCIFIO®或Surfver®输入格式的任何GIS或映射程序中。
交叉验证允许您根据采样数据测试插值系统
在交叉验证分析中,空间域中的每个测量点被单地从域中移除,并且通过Kriging或逆距离加权来估计其值,尽管它**存在过。以这种方式,可以构造域中每个样本位置的估计值与实际值的图,并用于测试插值系统。
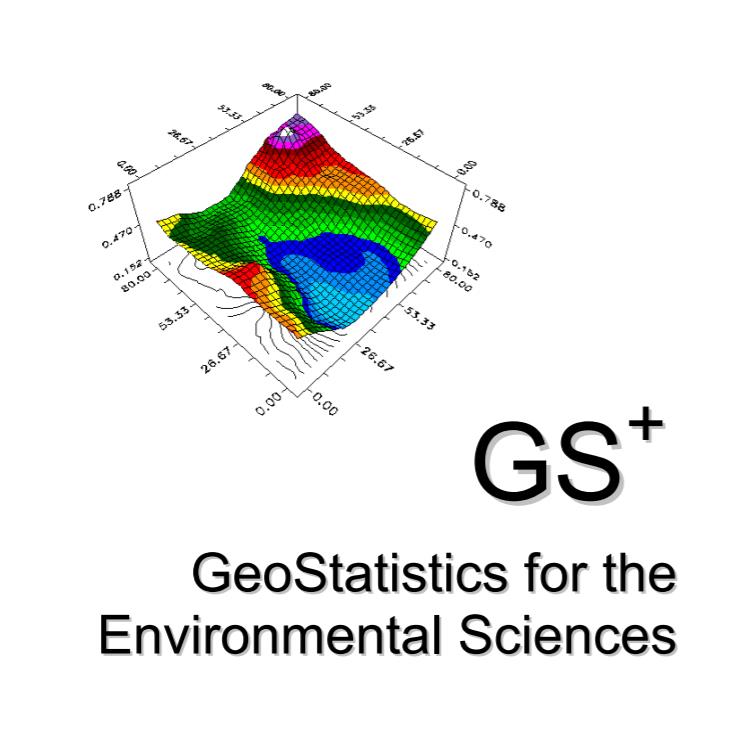
自定义您的GS+图形和地图的所有细节,并发布到任何地方
一组丰富的图形编辑选项允许您更改轴、字体、图、标题、符号和许多其他图形属性。可以将地图和图形打印或发送到Windows剪贴板或可由Web浏览器、文字处理器或接受WMF、JPEG、PNG或BMP格式的任何其他Windows程序读取的文件。
Create variograms on the fly
GS+ gives you complete control over variogram parameters such as
the active lag distance and the size of individual lag classes. Default values provide reasonable starting places from which you can optimize an analysis to suit a particular data set.
Directional (anisotropic) variograms are produced at the same time as isotropic variograms so you can readily evaluate whether autocorrelation is dependent on compass direction. This occurs, for example, when there is a slope effect or some other environmental feature that causes autocorrelation in one direction to be different from autocorrelation in another.
It’s easy to recognize anisotropy in GS+ by creating variogram maps – graphs of semivariance in different compass directions. If present, you can then easily define an angle of maximum variation to use for the anisotropic variogram models.

Variogram / Semivariogram Surface Maps – Identify anisotropic semivariance quickly and accurately. Maps of semivariance in every compass direction (the center marks the origin of each variogram / semivariogram) allow the axis of maximum variation to be easily identified.

Semivariance analysis in GS+ provides both isotropic and anisotropic variograms (also called semivariograms). Semivariance analysis is done before kriging, cokriging, or conditional simulation. You have complete control over separation interval classes – choose constant interval classes or define different break points for every lag class. Anisotropic directions can be individually targeted, and variograms / semivariograms can be scaled to sample variance.

Cross Validation Analysis allows one to test different variogram / semivariogram models used for kriging and conditional simulation. Bootstrapping provides comparisons of the actual value of every point sampled vs. its estimated value when removed from the data set.
科学软件网的客户涵盖产品涵盖教育、、交通、通信、金融、保险、电力等行业,并且为诸如北京大学、*大学、中国大学、中科院、农科院、社科院、环科院、国家、交通部、南方电网、国家电网、许继、南瑞等国内大型企事业单位、部委和科研机构长期提供相关产品。我们的品质,值得您信赖。
http://turntech8843.b2b168.com