使用期限*
许可形式单机
原产地美国
介质下载
适用平台windows
科学软件网是一个以引进国研软件,提供软件服务的营业网站,网站由北京天演融智软件有限公司创办,旨在为国内高校、科研院所和以研发为主的企业事业单位提供的科研软件及相关软件服务。截止目前,科学软件网已获得数百家国际软件公司正式授权,代理销售科研软件达一千余种,软件涵盖领域包括经管,仿真,地球地理,生物化学,工程科学,排版及网络管理等。同时,还提供培训、课程(包含34款软件,66门课程)、实验室解决方案和项目咨询等服务。
Work Seamlessly with all Coordinate Systems
Your job is to transform data into valuable visualizations. Surfer’s job is to make it easy for you. Surfer effortlessly manages unreferenced data and data projected in different/multiple coordinate systems. It really is that easy.
Surfer Coordinate System Features
Over 2500 predefined coordinate systems
Create custom coordinate systems
Search coordinate systems by name or EPSG number
Reproject coordinate systems
Over 80 ellipsoids
Over 45 predefined linear units
Create custom linear units
Add graticule or grid lines to view different coordinate systems on a map
简化工作流程
几分钟内Surfer就可以正常工作起来。Surfer的用户界面是为了猜测学习新程序的可能性。

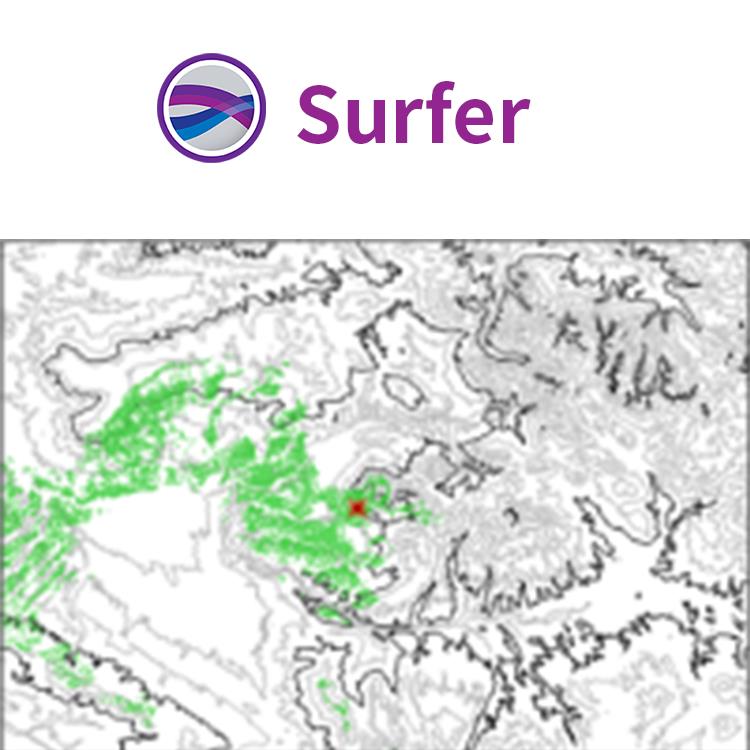
Create Professional Maps
Easily communicate both simple and complex spatial data. Surfer gives you the tools to create high-quality maps to clearly deliver your message to coworkers, clients, and stakeholders.
Surfer Map Types
Contour
Base
Post
3D Surface
Color Relief
Classed Post
3D Wireframe
1-Grid Vector
2-Grid Vector
Watershed
Grid Value
Viewshed
Point Cloud

Surfer适用的行业包括
农业
考古
建筑
教育
能源
环境
勘探
地球物理
程
地热
地理信息系统
海事
军事
采矿
泥浆录井
石油与天然气
可再生能源
无人机
公共事业
水利
创建的地图
轻松沟通简单和复杂的空间数据。Surfer提供创建高质量地图工具,可以清楚的向同事、客户和利益相关者传统信息。
Use Data in Date/Time Format
Visualize your data with respect to time! Surfer 12 supports dates and times as v alid data. This means you can use dates and times as a data variable for gridding, for creating post maps, and you can format data in the workshe et or text labels in multiple date and time formats.
< span>
Grid and Display Maps with Logarithmic Z Scale
Effectively display Z data that range over s everal orders of magnitude! You can grid data taking the log of the Z value prior to gridding, choose to have logarithmically scaled contour levels, or h logarithmic scaling applied to the color scale. This is extremely useful when your data file has extreme data ranges, such as concentration data where t he Z values can span multiple orders of magnitude (i.e. >1 to<20000).
科学软件网不定期举办各类公益培训和讲座,让您有更多机会免费学习和熟悉软件。
http://turntech8843.b2b168.com