使用期限*
许可形式单机
原产地美国
介质下载
适用平台windows
北京天演融智软件有限公司(科学软件网)前身是北京世纪天演科技有限公司,成立于2001年,专注为国内高校、科研院所和以研发为主的企事业单位提供科研软件和服务的国家。
好的展现数据
把您图形的每个方面都控制在小的细节上。Grapher广泛的定制选项让您以易于理解的方式传达复杂的想法。Grapher以佳的方式展现数据。
Grapher定制选项
添加图例、标题和坐标轴
包括插入缩放或图形放大镜
编辑所有轴参数,多轴
格式轴刻度为线性、对数、自然对数、概率或日期/时间
整合多个图形
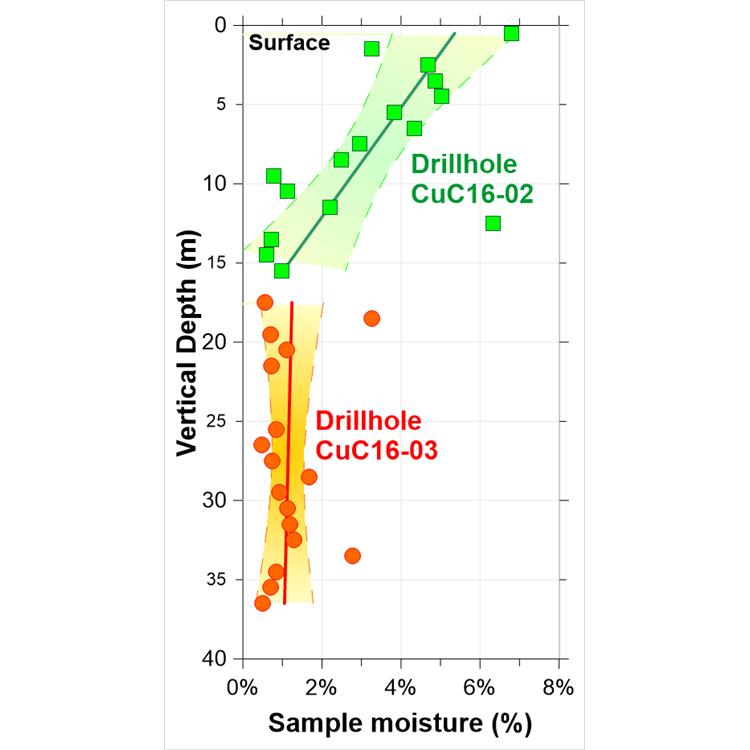
添加拟合曲线、错误条和统计报表
将每个图形组件放置在的位置
定义自定义行样式、颜色和填充
编辑文本、行、填充和符号属性
添加文本、折线、多边形、符号和样条线
更多…….
Create clear, concise graphs quickly and easily.
Customize every portion of every graph to make the graph completely unique to your situation!
Easily create custom graphs using the easy to follow Graph Wizard.
Add legends, curve fits, annotations, and drawing objects to complete the graph.
Communicate your graph to the entire world with full international fonts and character support. Display text such as Chinese, Russian, Greek, Hebrew, or Arabic.

Tabbed Managers
To create tabbed managers:
1. Left-click the title bar of the manager and drag over the other manager.
A docking mechanism will be displayed.
2. Hover the cursor over the center of the docking mechanism. The blue
rectangle shows where the tabbed manager will display.
3. Release the mouse button.
To return to individual managers from the tabbed view:
1. Click on the manager's name on the tab.
2. Drag the tab to a new position.

好的展现数据
把您图形的每个方面都控制在小的细节上。Grapher广泛的定制选项让您以易于理解的方式传达复杂的想法。Grapher以佳的方式展现数据。
Grapher 2D/3D绘图和统计分析软件
Grapher是一个功能全面的科学绘图软件包,允许用户以多种格式导入数据,创建和组合多种二维和三维图形类型,并以非常详细的方式定制这些图形。
数据可视化
好的呈现您的数据。Grapher提供70多种2D和3D绘图选项来大限度的显示数据。
分析数据
不会**数据可能隐藏的有价值信息。使用Grapher广泛的分析图表、工具和统计功能来识别趋势,找到新的见解和定位机会。Grapher提供对数据的整体视图。
结果说明
Grapher提供广泛的图形类型选项和无数的定制选项,让您以非常*理解的格式表达您复杂的想法。让您的数据跟Grapher说话。
Grapher is the ultimate technical graphing package available. This easy-to-use, powerful, dynamic program will help you create superior publication-quality professional graphs in minutes! Wow your audience every time they see your graphs.
Create one of more than 60 unique graph types. Create 2D or 3D linear or logarithmic line, scatter, function, class scatter, bubble, bar charts, and floating bar chart graphs. Create line , bar, rose, wind, and radar polar plots. Create 2D and 3D vector plots. Create line, scatter, or bubble ternary diagrams. Display high-low-close or candlestick specialty plots. Create statistical graphs including histograms, box-whisker, pie charts, and Q-Q plots.
,专注,专心是科学软件网的服务宗旨,开发的软件、传递*的技术、提供贴心的服务是我们用实际行动践行的**目标,我们会为此目标而不懈努力。
http://turntech8843.b2b168.com