使用期限*
许可形式单机
原产地美国
介质下载
适用平台windows
科学软件网是一个以引进国研软件,提供软件服务的营业网站,网站由北京天演融智软件有限公司创办,旨在为国内高校、科研院所和以研发为主的企业事业单位提供的科研软件及相关软件服务。截止目前,科学软件网已获得数百家国际软件公司正式授权,代理销售科研软件达一千余种,软件涵盖领域包括经管,仿真,地球地理,生物化学,工程科学,排版及网络管理等。同时,还提供培训、课程(包含34款软件,66门课程)、实验室解决方案和项目咨询等服务。
轻松自动化工作
不用浪费时间重复一样的工作。创建脚本来自动执行重复性任务,并直接从Grapher任务栏中运行您喜欢的脚本。可以从任何自动化兼容的编程语言中调用Grapher,如C++,Python或Perl。Grapher可以运送脚本编写者,一个内置的Visual Basic兼容的脚本工具。更好的是,使用脚本记录器对Grapher中的脚本进行操作转换。
系统要求
Windows 7, 8 (excluding RT), 10 or higher
32-bit and 64-bit operation system support
1024 x 768 or higher monitor resolution with minimum 16-bit color depth
At least 500 MB free hard disk space
At least 512 MB RAM
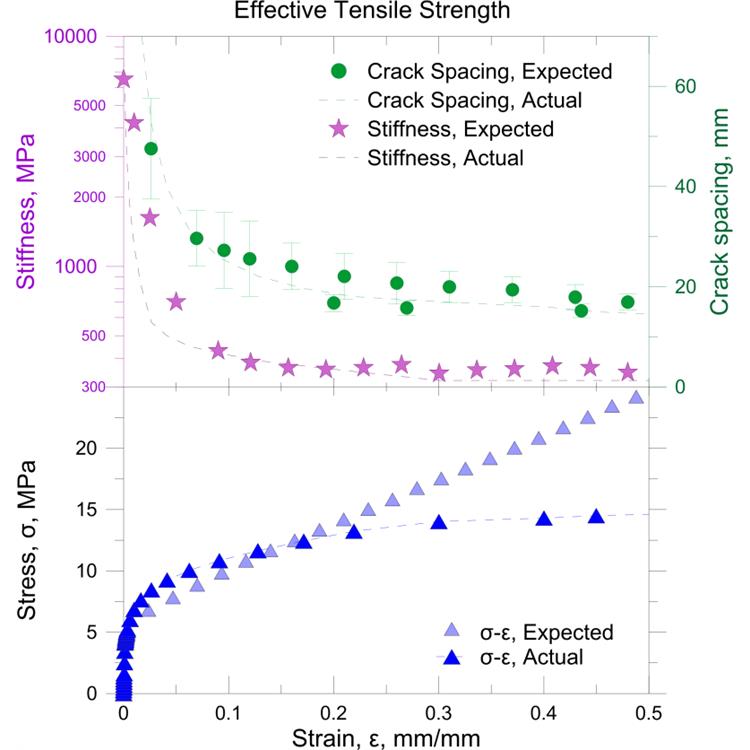
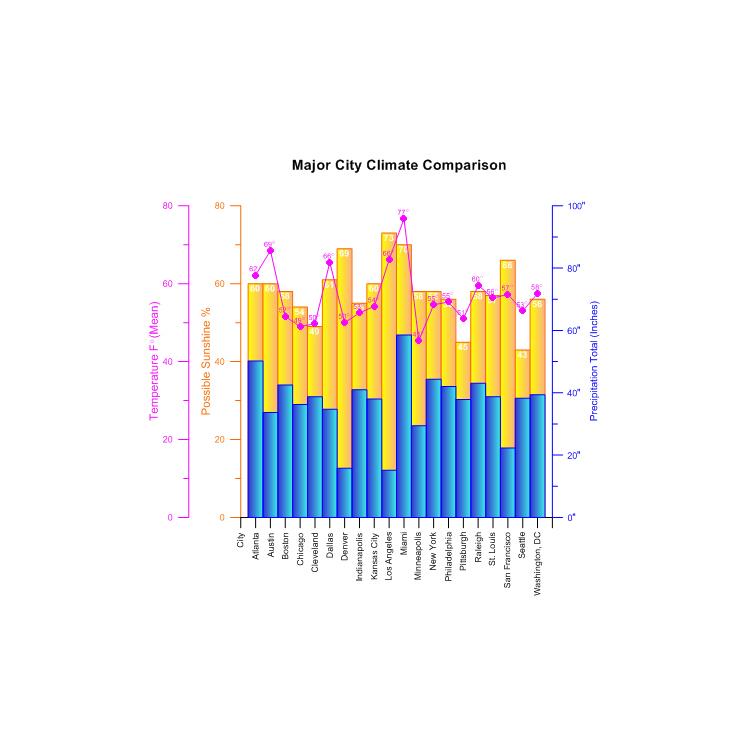
Create one of more than 60 unique graph types. Create 2D and 3D linear or logarithmic line, scatter, class scatter, bubble, function, and bar charts. Create line, bar, function, rose, and wind polar plots. Create line, scatter, or bubble ternary diagrams. Display data in several specialty graph types, including hi-low-close plots, 2D and 3D vector plots, contour maps, and surface maps. Display statistical information with histograms, pie charts, box-whisker plots, and Q-Q plots.

Docking Managers
Grapher has a docking mechanism that allows for easy docking of
managers. Left-click the title bar of a manager and drag it to a new
location while holding down the left mouse button. The docking mechanism
displays arrow indicators as you move the manager around the screen.
When the cursor touches one of the docking indicators in the docking
mechanism, a blue rectangle shows the window docking position. Release
the left mouse button to allow the manager to be docked in the specified
location. Double-click the title bar of a manager to switch between the
docked and floating positions.

Status Bar
The status bar is located at the bottom of the window. Check or clear the
View | Display | Status Bar command to show or hide the status bar.
The status bar displays information about the current command or selected
object in Grapher. The status bar is divided into three sections. The left
section shows the selected object name. If a menu command is selected, a
brief description of the command appears in the left section. The middle
section shows the cursor coordinates in page units. The middle section also
displays the graph's X and Y coordinates when using the Graph Tools |
Digitize commands or when the Display value on click option is selected in
the Options dialog. The right section displays the dimensions of the
selected object.
Customizing the Quick Access Toolbar
The Quick Access Toolbar is a customizable toolbar. One method that can
be used to add commands to the Quick Access Toolbar is to right-click on
the command in the ribbon and click Add to Quick Access Toolbar. The
command is automatically added to the end of the Quick Access Toolbar.
To customize the commands and their locations on the Quick Access
Toolbar, right-click the ribbon and click Customize Quick Access
Toolbar.

值得信任的解决方案
Grapher受到**数以千计的科学家、和商业的信任。他们信任Grapher并用它展示数据。
科学软件网不仅提供软件产品,更有多项附加服务免费提供,让您售后**!
http://turntech8843.b2b168.com