使用期限*
许可形式单机
原产地美国
介质下载
适用平台windows
科学软件网提供软件和培训服务已有19年,拥有丰富的经验,提供软件产品上千款,涵盖领域包括经管,仿真,地球地理,生物化学,工程科学,排版及网络管理等。同时还有的服务,现场培训+课程,以及本地化服务。
Achieve Deeper Insights
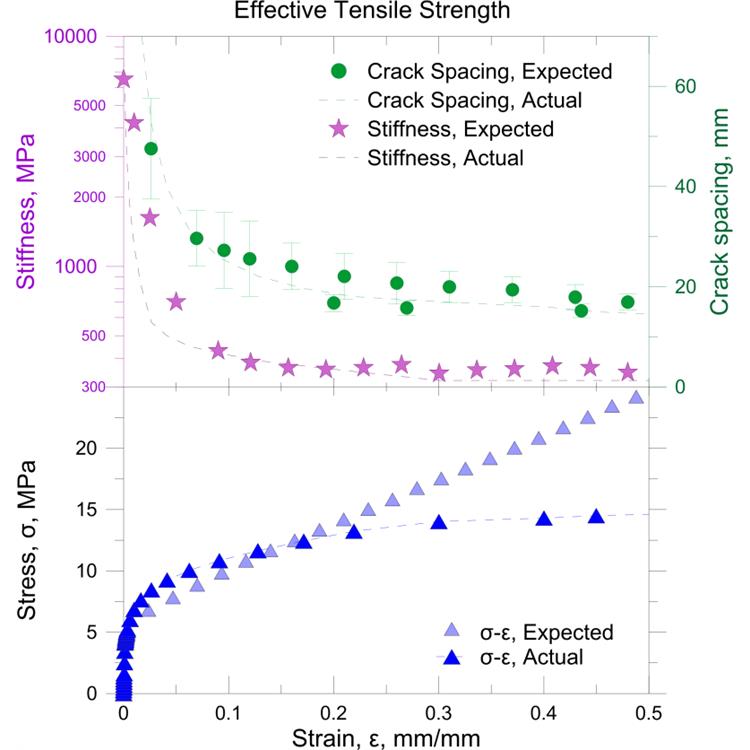
Make informed decisions with Grapher. Discover new opportunities and trends hiding in your data with Grapher’s statistical tools. Add custom or pre-defined fit curves, error bars, or compute statistics on the raw data for a thorough understanding of the underlying trend.
Grapher Statistical Tools
Insert custom or pre-defined fit curves
Apply confidence intervals
Include error bars
Perform statistical calculations on the raw data
Display statistical reports

简化工作流程
Grapher的用户界面的设计可以猜测学习新程序的可能性。我们在努力的简化工作流程,节省用户的时间和精力。
Grapher用户界面的功能
单个窗口查看、编辑和操作数据和图表
对象管理可以轻松的管理图形、坐标轴和其他对象
属性管理器便于访问绘图属性
工作表窗口,以便快速查看或编辑原始数据
Dock或浮动所有管理器
定制带状布局
欢迎对话框开始您的工作
图形导航,引导您创建图形
自定义用户界面以满足您的需要

Installing Grapher
Installing Grapher requires Administrator rights. Either an administrator
account can be used to install Grapher, or the administrator's credentials
can be entered before installation while logged in to a standard user
account. If you wish to use a Grapher single-user license, the product key
must be activated while logged in to the user account under which
Grapher will be used. For this reason, we recommend logging into
Windows under the account for the Grapher user, and entering the
necessary administrator credentials when prompted.

Grapher 2D/3D绘图和统计分析软件
Grapher是一个功能全面的科学绘图软件包,允许用户以多种格式导入数据,创建和组合多种二维和三维图形类型,并以非常详细的方式定制这些图形。
数据可视化
好的呈现您的数据。Grapher提供70多种2D和3D绘图选项来大限度的显示数据。
分析数据
不会**数据可能隐藏的有价值信息。使用Grapher广泛的分析图表、工具和统计功能来识别趋势,找到新的见解和定位机会。Grapher提供对数据的整体视图。
结果说明
Grapher提供广泛的图形类型选项和无数的定制选项,让您以非常*理解的格式表达您复杂的想法。让您的数据跟Grapher说话。
Grapher is the ultimate technical graphing package available. This easy-to-use, powerful, dynamic program will help you create superior publication-quality professional graphs in minutes! Wow your audience every time they see your graphs.
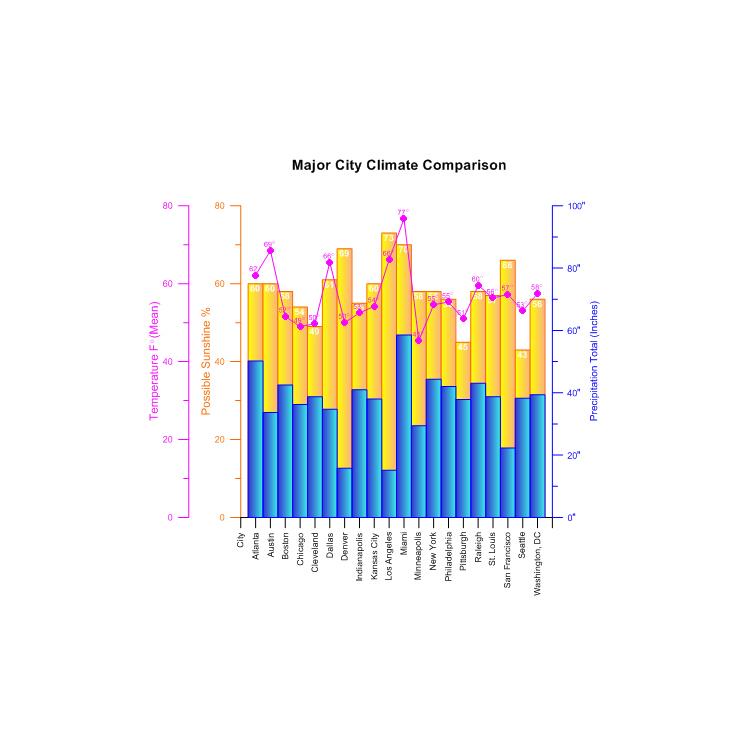
Create one of more than 60 unique graph types. Create 2D or 3D linear or logarithmic line, scatter, function, class scatter, bubble, bar charts, and floating bar chart graphs. Create line , bar, rose, wind, and radar polar plots. Create 2D and 3D vector plots. Create line, scatter, or bubble ternary diagrams. Display high-low-close or candlestick specialty plots. Create statistical graphs including histograms, box-whisker, pie charts, and Q-Q plots.
科学软件网为全国大多数高校提供过产品或服务,销售和售后团队,确保您售后**!
http://turntech8843.b2b168.com