使用期限*
许可形式单机和网络版
原产地美国
介质下载
适用平台windows
科学软件网提供大量正版科学软件,满足各学科的科研要求。科学软件网专注软件销售服务已达19年,全国大部分高校和企事业单位都是我们的客户。同时,我们还提供本地化服务,助力中国的科研事业。
Semivariance analysis in GS+ provides both isotropic and anisotropic variograms (also called semivariograms). Semivariance analysis is done before kriging, cokriging, or conditional simulation. You have complete control over separation interval classes – choose constant interval classes or define different break points for every lag class. Anisotropic directions can be individually targeted, and variograms / semivariograms can be scaled to sample variance.

Geostatistics is a class of statistical techniques developed to analyze and predict values of a variable distributed in space or time. It begins with a type of autocorrelation analysis called variography or semivariance analysis, in which the degree of self-similarity is displayed as a variogram. The variogram model is used to predict unsampled locations by kriging or conditional simulation, which produces estimates of the variable across the entire spatial or temporal domain

计算11种不同类型的自关测量变量
变差函数仅是GS+提供的一种自相关函数。GS+还包括相关图、磁图、RodoGrand、协方差图、漂移、Moran’I、分形维数、标准化、一般相对和成对相对变差函数。所有的各向同性和各向的方向上进行评估。
导入各种来源的数据
可以直接编辑GS+工作表,并且可以从各种来源导入数据到工作表中--以不同方式格式化的文本文件、Excel电子表格、Access和其他数据库文件,或从任何其他Windows程序中剪切和粘贴。也有几种方法来表示丢失的值,并且电子表格中的任何值都可以通过设置一个临时缺失的value属性从特定的分析中。工作表可接受**过10亿条记录。
在地质统计学之前总结您的数据
GS+还提供基本的参数统计,使您能够在地质统计学分析之前对数据进行描述。当一个数据集准备进行分析时,GS+报告统计数据,例如平均值、范围、标准差、峰度和偏度,也会创建频率和概率分布,这样您就可以评估偏离正常的情况。分位数散射图提供了样本位置的可视映射,并确定具有特定值的数据的位置。
满足各种需求的插值方法
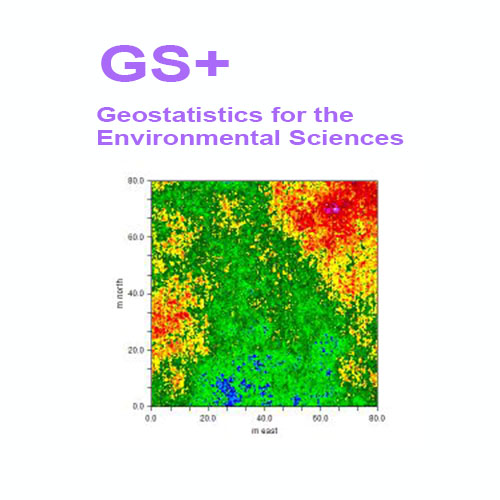
GS+提供了三种不同类型的插值。普通的kriging(包括块和准时性)提供了一个跨空间域属性的优估计。条件模拟还提供优估计,但在其位置上的原始数据可以用于映射域中的尖锐边界。基于简单的近邻计算,逆距离加权可能是好的非地质统计插值技术。GS+还提供cokriging,当您的主要数据由许多额外位置收集的数据支持时,这可能是有用的。Cokriging可用于块和准时kriging,并可用于有条件的模拟。协同定位cokriging可用于条件模拟。多边形掩码允许您在映射的域中包含或排除复杂的形状。跨越岛屿或避免在停车场内插补--还可以嵌套多边形并重叠它们。
What is geostatistics?
Geostatistics is a class of statistical techniques developed to analyze and predict spatial values of a property. It begins with a type of autocorrelation analysis called variography or semivariance analysis, in which the degree of spatial self-similarity is displayed as a variogram. A curve is fit to the variogram, and the equation that describes the curve - called the variogram model - is used to predict unsampled locations by kriging or conditional simulation. This produces optimal unbiased estimates of the property across the entire spatial domain. The same analysis can also be performed with one-dimensional data such as time, for example hourly or daily measures of some property, to provide optimal interpolations and error terms along a time line.

GS+ provides Kriging, Cokriging, Conditional Simulation, and Inverse Distance Weighting for interpolation across an area. Output is written to ASCII files that can be read for mapping by GS+, ArcView®, Surfer®, or other mapping or GIS programs.
科学软件网不仅提供软件产品,更有多项附加服务免费提供,让您售后**!
http://turntech8843.b2b168.com