使用期限*
许可形式单机
原产地美国
介质下载
适用平台windows
北京天演融智软件有限公司(科学软件网)前身是北京世纪天演科技有限公司,成立于2001年,专注为国内高校、科研院所和以研发为主的企事业单位提供科研软件和服务的国家。
简化工作流程
Grapher的用户界面的设计可以猜测学习新程序的可能性。我们在努力的简化工作流程,节省用户的时间和精力。
Grapher用户界面的功能
单个窗口查看、编辑和操作数据和图表
对象管理可以轻松的管理图形、坐标轴和其他对象
属性管理器便于访问绘图属性
工作表窗口,以便快速查看或编辑原始数据
Dock或浮动所有管理器
定制带状布局
欢迎对话框开始您的工作
图形导航,引导您创建图形
自定义用户界面以满足您的需要
Automate the graphing process with the included Scripter?.
Use the simple Recorder to record your graph making process! Play back scripts to create the graph with a single click!
Export graphs for use in presentations and publications in one of Grapher’s many export formats, including vector PDF, EMF, and EPS.
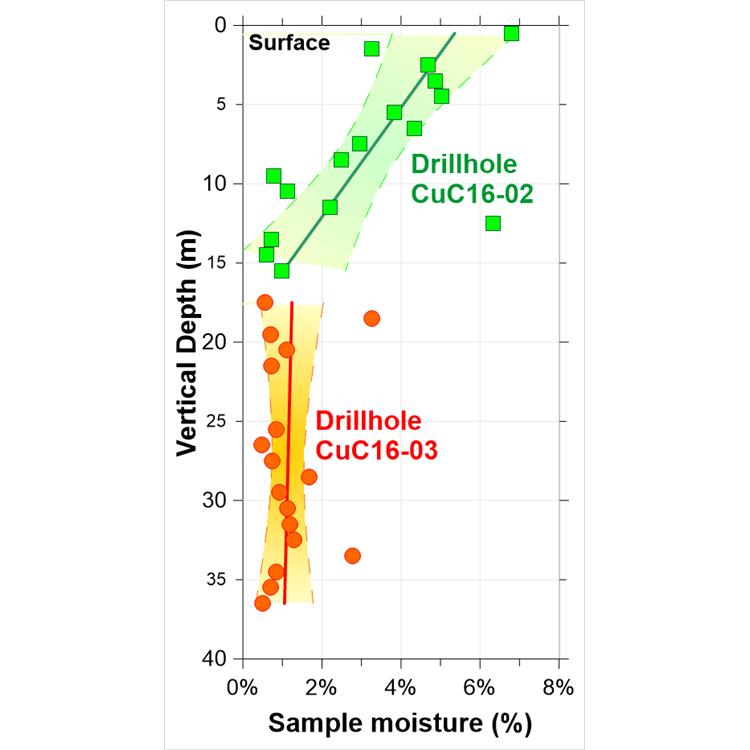
Combine multiple axes or plots to display fabulous multiple variable graphs.

Uninstalling Grapher
To uninstall Grapher, follow the directions below for your specific
operating system. We recommend deactivating your license prior to
uninstalling Grapher if you are using a single-user license.

Creating Graphs
You can create graphs in several ways in Grapher. These methods include
creating graphs with the graph wizard, from the Home tab commands,
from the worksheet, and from templates.
Additional plots, axes, legends, titles, summation plots, duplicate axes, and
magnifiers can be added to the graph after it is created. All properties of
the plot can be edited after the graph is created.
Creating Graphs with the Graph Wizard
The Graph Wizard leads you through the necessary steps to create a new
graph. This is often the fastest way to make a graph with multiple plots
from a single data file. The Graph Wizard also makes it easy to add items
such as axes, legends, and titles.
To create a graph with the graph wizard:
1. Click the Home | New Graph | Wizard command.
2. In the Graph Wizard - Select Data dialog, select the data file for the
graph from the Select File list. A preview of the data file is displayed in
the Data Preview section.
3. Click the Next button.
4. In the Graph Wizard - Select Plot Type dialog, choose a plot type for
the new graph. Filter available Plot types with the Category list or
search for plot types with the Search bar. See a description of the
selected plot type in the Description section, or click Help to view
descriptions for all plot types.

Docking Managers
Grapher has a docking mechanism that allows for easy docking of
managers. Left-click the title bar of a manager and drag it to a new
location while holding down the left mouse button. The docking mechanism
displays arrow indicators as you move the manager around the screen.
When the cursor touches one of the docking indicators in the docking
mechanism, a blue rectangle shows the window docking position. Release
the left mouse button to allow the manager to be docked in the specified
location. Double-click the title bar of a manager to switch between the
docked and floating positions.
科学软件网主要提供以下科学软件服务:
1、软件培训服务:与国内大学合作,聘请业内人士定期组织软件培训,截止目前,已成功举办软件培训四十多期,累计学员2000余人,不仅让学员掌握了软件使用技巧,加深了软件在本职工作中的应用深度,而且也为**业人士搭建起了沟通的桥梁;
2、软件服务:提供软件试用版、演示版、教程、手册和参考资料的服务;
3、解决方案咨询服务:科学软件网可向用户有偿提供经济统计、系统优化、决策分析、生物制药等方面的解决方案咨询服务;
4、软件升级及技术支持服务:科学软件网可向用户提供软件的本地化技术支持服务,包括软件更新升级、软件故障排除、安装调试、培训等;
5、行业研讨服务:科学软件网会针对不**业,邀请国内外以及软件厂商技术人员,不定期在国内举办大型研讨会,时刻关注*技术,为国内行业技术发展提供导向。
http://turntech8843.b2b168.com


